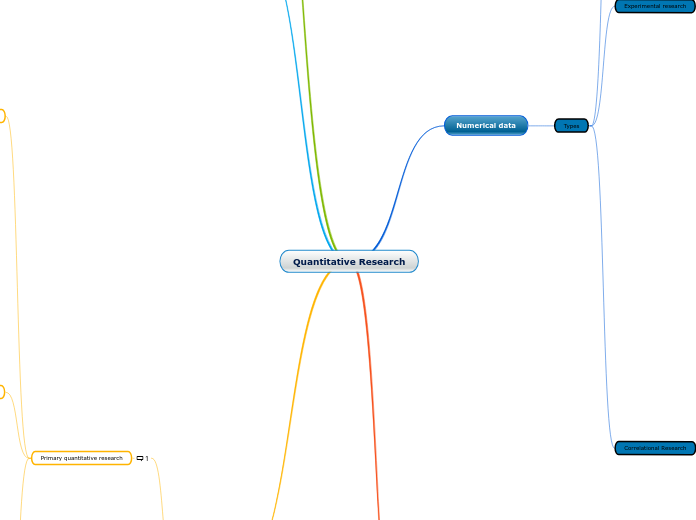
Quantitative Research
Numerical data
Types
Survey research
Experimental research
The manipulation of variables
Independent Variables(The cause)
Dependent Variables (The effect)
Basic steps
Selecting & defining research problem
Design experiment
Participant
Sample
Designs
Strucuture through variables
Preconceived plan
Constraints on choosing particular design
Materials(instruments)
Procedures
Analyzing data
Collecting data
Running the experiment
Interpreting results
Analyse data using SPSS
The t-test
Independent t-test
Dependent t-test
Analysis of Variance (ANOVA)
Measurements
Reaction times
Physiological responses
Self report responses/questionnaire
Behavioral measures
Quasi-Experimental Research
The use of intact groups of subject
Designs
The 'One group post-test/ design
The 'One group pre-test/post-test' design
Static group comparison
Interrupted time-series designs
Experimental validity
Internal validity
History
Testing
Instrumentation
Selection of participants
External validity
Selection-treatment interaction
Reactive effects of experimental arrangement
Pretest-treatment interaction
Correlational Research
Basic steps
Selecting a problem
Choosing a sample
Selecting or developing instruments
Tests
Questionnaire
Determining procedure
Straightforward design procedure
Collecting data
Analyzing data
Computing a correlation coefficient
Preliminary analysis of the data
Scatterplot
Interpreting results
Analysis on SPSS
Data entry
Entered in seperated column
Draw a scatterplot
Run a correlation analysis
Advantages of Quantitative Research
Collect reliable and accurate data
Collected
Analyzed
Predict conflict
Presented in numbers
Quick data collection
Straightforward and time consuming
Represent a population
Involvement of statistic
Conducting and analyzing results
Wider scope of data analysis
Eliminate bias
No scope
Personal comments
Biasing of results
Results
Numerical
Formal Instruments
Tests
SPSS
Questionnaires
Survey and polls
Fundamental levels of measurements
Nominal
Ordinal
Interval
Ratio
Difference questions types
Close-ended questions
Multiple choice questions
Rating-scale questions
Differential scale questions
Survey distribution and survey data collection
Buy respondents
Embed survey on a website
Social distribution
QR code
QuestionsPRO apps
SMS survey
Checklist
Formal paper-and-pencil instruments
Research topic
Specific
Types
Statistical
Mathematical
Computational techniques
Systematic experimental study
Methods
Primary quantitative research
Techniques and types of study
Survey research
Cross-sectional survey
Longitudinal survey
Correlational research
Data collection methodologies
Probability Sampling method
Simple random sampling
Random selection
Large target population
Stratified random sampling
Large population divided into groups
Randomly choose sample
Cluster sampling
Geographic
Demographic
Systematic sampling
Starting point of the sample choose randomly
Choosing using fixed interval
Dividing opulation size by target sample size
Non-probability sampling method
Convenience sampling
Proximity to researcher
Quick and easy to implement
Consecutive sampling
Similar to convenience sampling
Choose single elements/group of samples
Conduct research consecutively
In significant period
Information collecting
Knowledge of target traits
Personalities to for strata
Quota Sampling
Subtopic
Snowball sampling
Target audience
Difficult to contact(to get information)
Judgement sampling
Sample created
Skills
Experiences
Data Analysis Techniques
SWOT Analysis
Strength
Weakness
Opportunities
Threat
Conjoint Analysis
Learn the respondents traits
Involve daily activity
Cross-tabulation
Preliminary statistical method
Patterns
Relationships
Trends
TURF (Totally Unduplicated Reach and Frequency Analysis)
Analyzed along with the frequency of communication
Secondary quantitative research
Existing data
Data available on the internet
Proving the relevance of previously collected data
Government and non-government sources
Reliable
In-depth
Increase validity of research
Public libraries
Copies of information
Documents
Educational institutions
Commercial information sources
TV
Journal
Magazines
Radio
