por Aleskei Pushchenko hace 11 meses
59
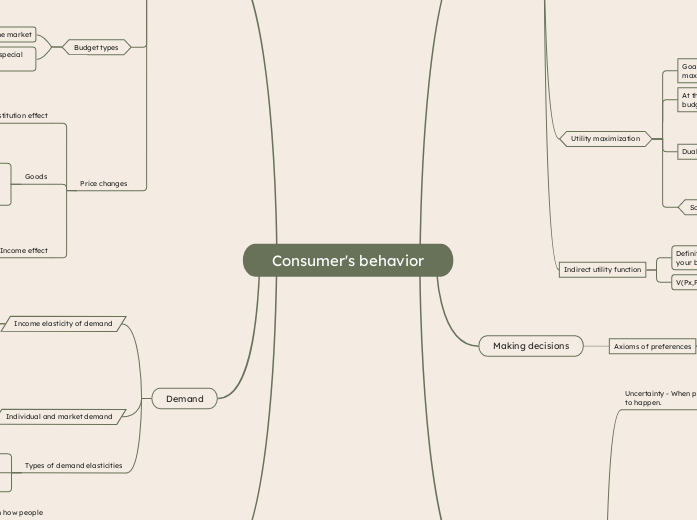
Consumer's behavior

por Aleskei Pushchenko hace 11 meses
59

Ver más
Cross-price elasticity of demand
Price elasticity of demand
EI interpretation
EI = 0
Good is income independent
0
Good is income inelastic
EI > 1
Good is income elastic
If a good becomes cheaper, you fell like you have more free money to spend, so you might buy more of that good or spend money on something else
Inferior goods: Price goes down, you buy more
Inferior
EI < 0
We buy less when income increases
Normal
EI > 0
We buy more when income increases
If a good becomes cheeper, you'll tend to buy more of that good and less of other goods that are now relatively more expensive. So, substitution effect is more about relative prices
Inferior goods: Price goes down, you buy less
Normal goods: Price goes down, you buy ,more
Change in prices
If Py decreases, the line rotates outward
If Px increases, the line rotates inward
Change in income
Less income - Line shifts inward
More income - Line shifts outward
Slope is equal to MRT
MRT
MRT formula: -Px/Py
Definition: how much of one good you have to give up to get more of the other
Fairness
Unfair insurace
The premium that you pay is higher than the expected cost of the risk
Fair insurance
The premium that you pay is equal to the expected cost of the risk
Only this one is directly related to the topic
This is the way to measure the risk aversion via math. This coefficient tells us how risk averse someone is by looking at the curvature of the utility function. The higher it is, the less risky they are.
Risk premium is calculated as a difference between the expected value of the risky option and the amount that someone is willing to accept for certainty
Risk premium - the amount of money that one will pay in order to avoid taking risks.
Risk neutral - those, who rely only on expected value while making decisions
Risk loving - people who enjoy taking risks
Risk averse - people who prefer certainty
Expected utility = p1 * U(x1) + p2 * U(x2) + ...+ pn * U(xn)
Expected utility - weighting each possible outcome by its probability
More is better
if option 1 is preffered to option 2 and option 2 is preffered to option 3, then option 1 is preffered to option 3
Any 2 things can be compated
Interior solution
Corner solution
Lagrange method
You can not only try to maximize utility, but also to minimize expenditure, while keeping the utility at the same level.
Expenditure function - E(U,Px,Py)
Px, Py = the prices of the goods
U = The target utility level
E = total expenditure
MRS = MRT
MUx/MUy=Px/Py
Maximize U(x,y) subject to Px*x+Py*y=I
Cobb-Douglas preferences
Indifference curve: Smooth, convex curves. They show diminishing MRS - you're willing to trade less of one good for the other as you get more
Utility function: U(x,y) = x^a+y^b
Perfect complements
Indifference curves: L-shaped as happiness is only increased if person gets more of both goods
Utility function: U(x,y) = min(ax,by)
Perfect substitutes
Indifference curves: straight line as person is ready to trade one good for another at a constant rate
Utility function: U(x,y) = ax+by
Key aspects
Higher curves - higher level of Utility
Definition - A curve showing all the combinations of two goods that give you the same level of Utility
Shape - Indifference curves usually slope downward
Key rule - Indifference curves never cross, because that would brake the logic of transitivity
MRS represents how much of one good you are willing to trade for another while keeping utility constant
MRS formula: MU1/MU2
Marginal Utility(MU)
MU - The extra utility from one more unit of something
Calculation of MU - To calculate MU you need to take a derivative of U(x,y) with respect to each variable
Peculiarities of MRS
Diminishing MRS - the more of a good 1 you have, the less good 2 you are willing to give up for an extra good 1
Convexity - Person prefers balanced bundles