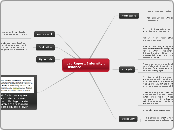
Lab Report: Intensity v Distance
Formatting
Label axes where possible
Make sure you are in the third person impersonal.
Hypothesis
I didn't ask for it, but I guess I would have preferred more explanation in the hypothesis. In this example the reasoning for the inverse square is given
Analysis
The constant has units lux cm^2 to make an equivalence relationship.
Make sure you use "curve straigtening" to find the relaitonship.
When you are straigtening the curve, you need to transform the independent variable. In this case we controlled the distance from the light source and observed light intensity, so transform the distance variable.
There is an intercept with the straigtened curve. Where did it come from. Is it within the error of the instruments, or could it have been stray light.
Be critical about the sources of error. We are measuring using signficant figures, so unless we have a clear reason to reject a reading, we shouldn't use the "human error" as a possible source of the anomaly.
There were only 2 vairables that were measured and it wouldn`t matter if the idstance we moved the cart between readings was greater or less each time. As well, the time of each reading would be irrelevent as well.
try to label axes appropriately
Vacabulry
This isn't an exponential relationship, just an inverse power relationship
Assessment
I have mostly commented your Google doc. Be sure to turn on comments to see the feedbackl
Evaluation
I know that the labs cam close together and you don't have feedback from the first to help you correct errors for the second. These will be weighted as 40, rather than 80 or 100
