Business Statistics
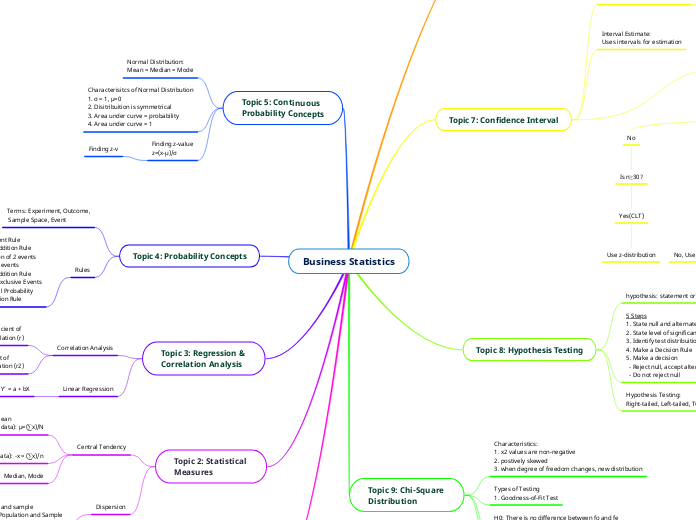
Topic 1: Introduction
Types of Organisation of Data
Contingency Table, Frequency Distribution
Types of variables
Qualitative (Non-numeric),
Quantitative (numeric): Discrete or Continuous
Basic Terms
Population (N), Sample (n)
Subdivisions
Inferential/Descriptive Stats
Topic 2: Statistical
Measures
Dispersion
1. Range
2. Variance: Population and sample
3. Standard Deviation: Population and Sample
Central Tendency
Median, Mode
Sample Mean
(Ungrouped Data): ¯x = (∑x)/n
(Grouped Data): ¯x = (∑fx)/n
Population Mean
(Ungrouped data): μ=(∑x)/N
(Grouped Data): μ=(∑fx)/N
Topic 3: Regression &
Correlation Analysis
Linear Regression
Y’ = a + bX
Correlation Analysis
Coefficient of
Determination (r2)
Coefficient of
Correlation (r)
Negative, Positive,
or No correlation
Topic 4: Probability Concepts
Rules
1. Complement Rule
2. General Addition Rule
- Intersection of 2 events
- Union of 2 events
- General Addition Rule
- Mutually Exclusive Events
3. Conditional Probability
4. Multiplication Rule
Terms: Experiment, Outcome,
Sample Space, Event
Topic 5: Continuous
Probability Concepts
Finding z-value
z=(x-µ)/σ
Finding z-v
Characterisitcs of Normal Distribution
1. σ = 1, μ=0
2. Disitribuition is symmetrical
3. Area under curve = probability
4. Area under curve = 1
Normal Distribution:
Mean = Median = Mode
Topic 9: Chi-Square
Distribution
Test Statistics: x2 =∑[(f_o-f_e )^2/f_e ]
H0: There is no difference between fo and fe
H1: There is a difference between fo and fe
Types of Testing
1. Goodness-of-Fit Test
Characteristics:
1. x2 values are non-negative
2. postively skewed
3. when degree of freedom changes, new distribution
Topic 8: Hypothesis Testing
Hypothesis Testing:
Right-tailed, Left-tailed, Two-tailed
5 Steps
1. State null and alternate hypothesis
2. State level of significance
3. Identify test distribuition and calculate Test Statistic
4. Make a Decision Rule
5. Make a decision
- Reject null, accept alternate
- Do not reject null
hypothesis: statement or assumption
Topic 7: Confidence Interval
Conditions
Population Normal?
Yes
Is σ known?
Yes, use z-distribution
No, Is n≥30?
Yes (CLT), Use z-distribution
No, Use t-distribution
No
Is n≥30?
Yes(CLT)
Use z-distribution
Interval Estimate:
Uses intervals for estimation
Point Estimate (PE):
Uses one value for estimation
's' is the PE of population
standard deviation
sample mean is the PE of
population mean
Topic 6: Sample Probabilities
Conditions of sample
mean to be normal
Normal distribution
(regardless of sample size)
Distribution unknown, n≥30
Central Limit Theorem (CLT): If the sample size is more than 30, the shape of the sampling distribution of the sample mean is close to a normal probability distribution.


