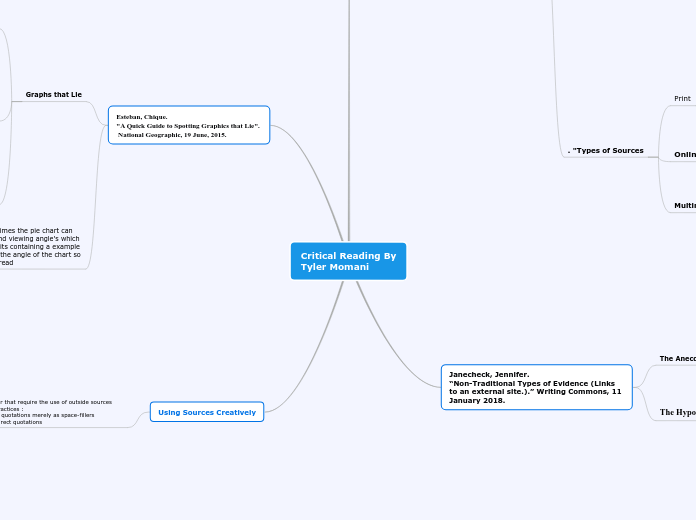
Critical Reading By
Tyler Momani
university of Mississippi (UM). "CRAAP Analysis for Print Articles (Links to an external site.)." Writing Skills Lab. Edited by Lumen Learning. Lumen Learning, Portland, OR, 2019a
"Types of Sources (Links to an external site.)." Writing Skills Lab. Edited by Lumen Learning. Lumen Learning, Portland, OR, 2019b.
"CRAAP Analysis for Print Articles
When was it published ?
When picking a source its important t to look at when it was published because the newer the published date the more up date the information is going to be for instance if your looking fair recent advances in AI computing your going to want to find a fairly recent article because its going to contain the newest information on the topic.
How does this print source contribute to my research paper?
When looking at the source think about how the source can help with your paper ,ex: can this source help prove your point or be used as supportive evidence .The whole purpose is for the source is to be beneficial for you whether that's evidence or background information .
Is the person, organization, or institution responsible for the content of the print source knowledgeable in that subject?
When looking at ta source make sure that the writer is credible on the subject example is your researching ai computing and you have 2 choices 1 is apple and the other is a random tech company the better choice is apple because they are experienced on the topic and the information that they provide is fairly accurate.
How free from error is this print source?
Its important to look at if the structure is correct the work cited or the formatting if they are missing some aspects that can mean that the source is probably the one you don't want to use. A good source would have all the important parts
Who is this information written for or this source developed for?
That means who is the article made for or better who is the target audience based on atht information you identify if its what your looking for
. "Types of Sources
print sources are sources like books ,journals ,magazine articles ,reports .Writing that later have been made to hard copy's typically contains valuable information on the subject your arguing
Online
Online sources are things like Wikipedia and other websites .Depending on what domain the website has can tell you if its a good source or not example is Wikipedia is good if you need some background information but its not 100 percent accurate
Multimedia
Multimedia sources are sources such as Netflix documentaries or YouTube videos talking on three history of the subject .Uslaly containsenouigh information to give a good understanding on nt eh subject
Janecheck, Jennifer.
“Non-Traditional Types of Evidence (Links to an external site.).” Writing Commons, 11 January 2018.
The Anecdote
An anecdote is a short narrative explaining an event or experience of some sort. It is a particularly useful form of support when writing in the memoir and narrative genres.(Janecheck 1
A simpler definition would be a small story or pitch rather
The Hypothetical Example
A hypothetical example is a “for instance” for your reader—a potential instance or example that might illustrate your claim in action. Such an example will often follow one of the following phrases or abbreviations: “for instance,” “for example,” “i.e.,” or “e.g.,” though the latter two, realize, will only follow a comma and will not start a new sentence as could “for instance” or “for example.”(Janecheck 6).
Esteban, Chique.
"A Quick Guide to Spotting Graphics that Lie".
National Geographic, 19 June, 2015.
Graphs that Lie
1. Broken scales show drama where it doesn't exist
when looking at 2 graphs and you notice the on the first obe theres a slight change and then you look at the next and you see a dramatic change that can be a sign of a bad graph or a false chart
Showing data on two different scales can make for an apples-to-oranges comparison
when looking at a graph some graphs contain information on 2 things if the graph compares 2 things and shows the information by overlapping both graphs that makes it confusing to understand
the better way is to generate 2 separate graphs 1 for each subject
ignoring population size makes rates impossible to compare.
this when your looking at graphs that are comparing something like dangerous cities the graph is false when you see a drastic changer in the numbers for instance LA has 407 murders and then you look at another city and it goes down to 200 that a huge jump
Decoration can be deceiving
the meaning of this is sometimes the pie chart can be made with fancy colors and viewing angle's which can confuse the information its containing a example is to cant get the colors and the angle of the chart so that it looks off and hard to read
Using Sources Creatively
When writing paper that require the use of outside sources here some good practices :
1.Avoid using long quotations merely as space-fillers
2.Don’t use only direct quotations
