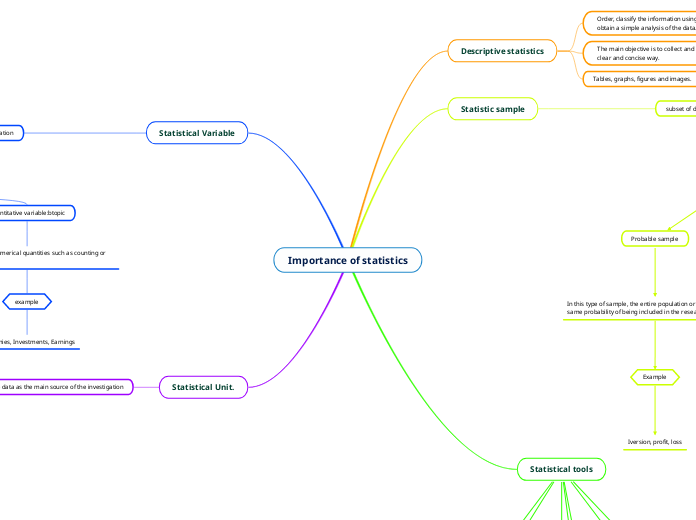
Importance of statistics
Descriptive statistics
Order, classify the information using graphs and tables to obtain a simple analysis of the data.
The main objective is to collect and present information in a clear and concise way.
Tables, graphs, figures and images.
Statistic sample
subset of data to simplify the information of an investigation
Types
Probable sample
In this type of sample, the entire population or subject has the same probability of being included in the research result.
Example
Iversion, profit, loss
Probable not sample
In this type of sample, the data or elements that may be probable depending on the investigation are taken as a basis.
Example
Survey, Amount,
Statistical tools
Data collection sheet
Histogram
Pareto chart
Cause-effect diagram
Dispersion diagram
Stratification
Control charts
Statistical Variable
Measure a set of items to represent or collect information
Types
Qualitative variables:
Represent characteristics that cannot be measured in numbers only in categories or groups.
example
Savings, Travel, Classification
Quantitative variable:btopic
Are represented in numerical quantities such as counting or measuring.
example
Companies, Investments, Earnings
Statistical Unit.
One single data as the main source of the investigation
Types
experiential unit: member of a set of objects that are initially equal
Sampling unit: object that has been sampled from a statistical population
