Statistics: The
Interpertation of Data
Organizing and
Representing Data
Dot Plot
Example
Dot Plot Creating
Stem and Leaf

Example using a set of numbers.
Histograms
Example using birth
weight of lambs.
Line Graphs
Example using average temperatures.
Bar Graph
Example of a
polled survey.
Bar Graph Review
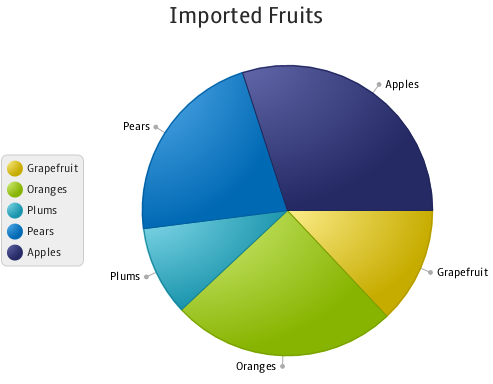
Pie Charts
Example using
imported fruits
Pie Chart Practice
Pictographs

Example of
books sold
Lessons and Games
Mean Median Mode
Graphs
K-2 Practice
Data Analysis
Games
Lesson Ideas
Measuring the Center and
Variations of Data with
How to Videos
Mean
Video teaching on, how to find the mean
Median
Video on how to find the median
Mode
Video showing how to find
the mode of a data set
Range
A teaching video on how to find the range
Quartiles
Video Teaches on the different
quartiles of a set of data
Standard Deviation
Outlier
How to find the outliers.
Box Plot
Video on creating Box Plot
Statistical Inference
with Definitions
Population
Sample
Random Sample
Normal Distribution
Percentile
Z Score