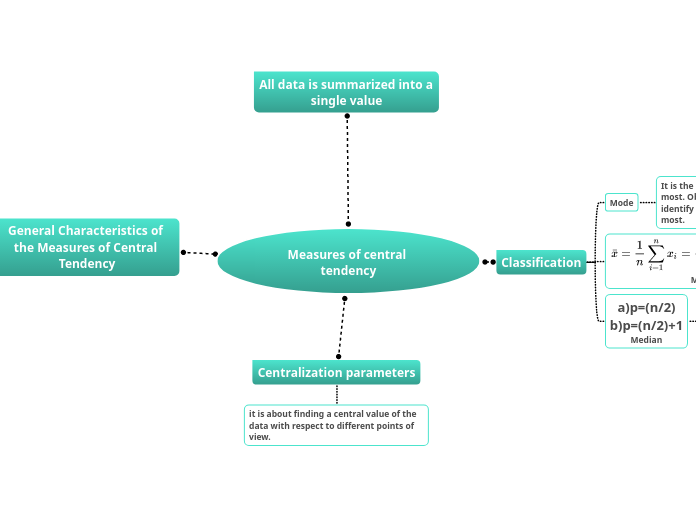
Measures of central tendency
Classification
Mode
It is the number that is repeated the most. Observe this list of data and identify the figure that appears the most.

Mean
It is the average value of the data group, that is, the figure obtained by adding all the data and dividing the result by the amount of data.
a)p=(n/2)
b)p=(n/2)+1
Median
Calculating the median is much easier because it is just the middle value, that is, the one in the middle of the list.
All data is summarized into a single value
General Characteristics of the Measures of Central Tendency
They allow us to appreciate how much the groups resemble each other.
They are values that are calculated for a set of data and used to describe it in some way.
It is the value that is near the center of all values, which is why they are called measures of central tendency.
They are used as a mechanism to summarize a characteristic of a particular data set.
It is also often used to compare one set of data against another.
Centralization parameters
it is about finding a central value of the data with respect to different points of view.
