によって daira stefania guaman ferrnandez 3年前.
349
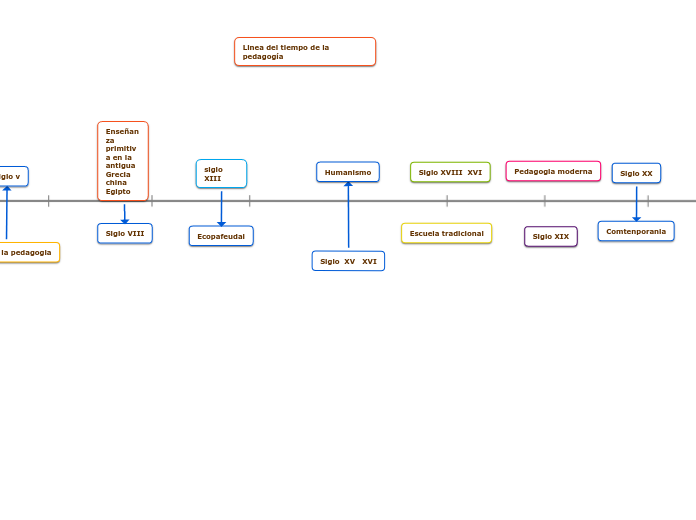
Siglo XV XVI

によって daira stefania guaman ferrnandez 3年前.
349

もっと見る
Does your chart start at a particular event? Add a title for this event, or delete this topic if it is not needed.
Items or ideas are positioned along the axis. For example, they might be events in a sequence or on a timeline.
Double-click to add a new topic to the map.
Add a legend for the left/right direction in your chart. For example, it might represent time after an event, or steps in a sequence.