DATA ANALYSIS
Numerical Methods
Measures of
Central Tendency
Mean
The mean is the sume of n numbers divided by n.
The weight of the value is the nº of times a value
appears on the list
Median
Middle value of an ordered list of numbers.
Mode
Number that occurs most frecuently in the list.
Measures of
Position
Quartiles
Percentiles
Measures of
Dispertion
Range
G-L
Interquartile range
Q3 - Q1
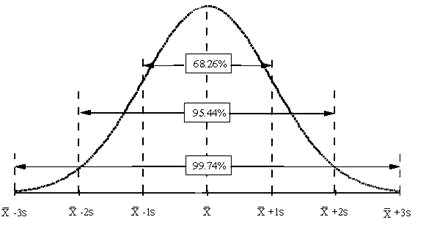
Standard deviation
1) Calculate the mean
2) (Value of mean - each nº)2
3) Calculate the mean of differences
4) Possitive square root
*Sample Standard Deviation: Mean of differences
/ n-1.

Example
Graphical Methods

Bar Graphs

Segmented Bar Graphs

Bar Graphs with Multiple Variables

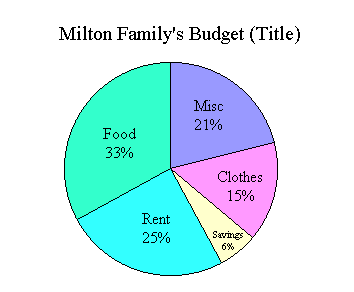
Circle Graphs

Histograms

Scatterplot

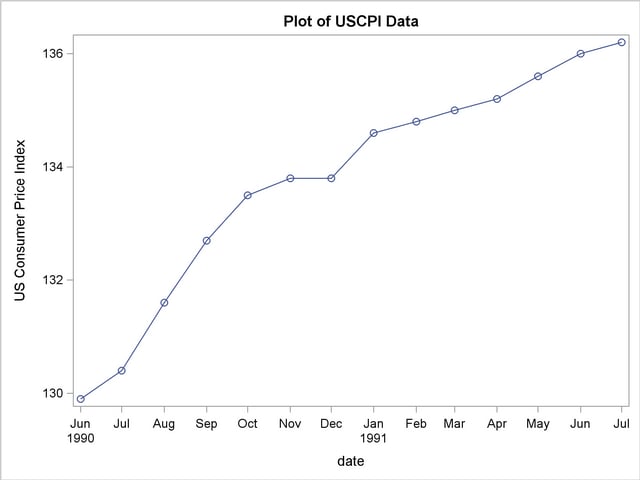
Time Plots
Positions:
Least (L), Median (M), Greatest (G)
Q1=P25
Q2=M=P50
Q3=75

Example
