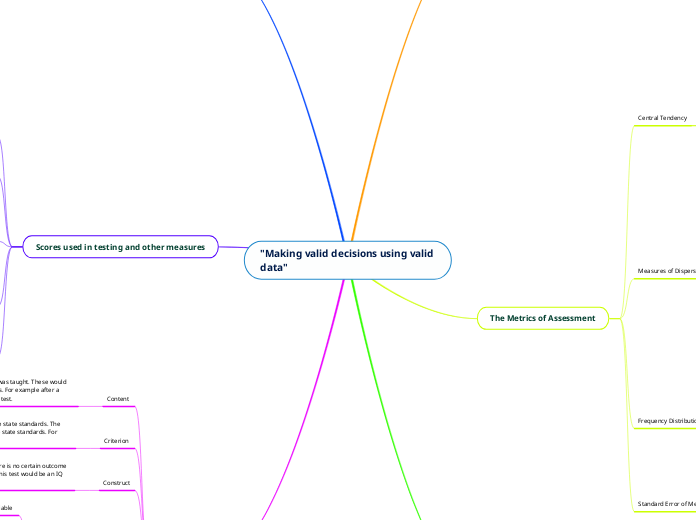
"Making valid decisions using valid data"
Assessment Decisions in Context
Garbage in Garbage out.
The data you collect needs to be valid so that you have valid information to make a valid decision.
Valid data is accurate, reliable, robust, and complete
Validity relates to reliability
Reliability means a test is consistent in the way it is grade and the material
How do you data in valid ways?
Scope of assessment, valid instruments, gather data, make a decision.
IDEA
6 Principles of IDEA
Free Appropriate Public Education (FAPE)
Non-Discriminatory Evaluation
Zero reject
Least Restrictive Environment (LRE)
Procedural Safeguards
Parental Participation
The Metrics of Assessment
Central Tendency
Mean
The mean, or average, helps you see overall all howl the class is preforming. It is not the best measure of how all of your students are doing became you could have an average score and not a single one of your students received that score.
x̄ = (SUMx)/n
Median
The middle data point.
Mode
The most common test score. This helps you know where the majority of your class it at became you can see the scores that are most common in your data set.
Measures of Dispersion
Range
Range is the difference between the extreme scores (highest–lowest).
Variance
"It takes each score difference from the mean (x-mean). But the total of all of the differences added together would be zero, because some would be negative and some positive and they would cancel each other out. Therefore we square them, which makes them all positive and then add them together. In the equation below, we take the first value (x1) and subtract the mean and square the difference. Then the same with the second value, continuing to the nth value. Then we divide by n."
Standard Deviation
The SD is simply the square root of the variances. In the variance you had to square the numbers to prevent negative numbers, but that is not what the SD is. So you have to put all those numbers back to what they were without them being squared. So you take the square root of them.
You can be a certain amount of SD from the mean.
Frequency Distributions
Correlation: when two or more things have some connection with each other. They do not have to cause each other, but they can.
Causation: when two or more things correlate and cause each other to happen.
Standard Error of Measurement
SEM is taking into account the error that will enviably happen when it comes to assessments. There will always be some error for some reason, could be random or could be be a measurement error. But you have to take into account this error.
SEM = SD 1Square root of (1- r)
Developing norm-referenced tests
Standardization: The process of making something the same by predetermined rules and exportations.
Norm Referenced Tests
How to cerate them: Define the purpose, develop a pool of test items, pilot test the items, revise the items and testing procedures as needed, administer the test to a norm group.
Formal assessments
Sources and types of Assessment Data
RIOT
Records
Anecdotal records
Interviews
Interview parents, teachers, the child, ect
Help to confirm findings from other sources.
Observations
Systematic and Nonsystematic
Tests
Validity and Reliability
Informal
interviews, teacher made tests, curriculum based assessments, and portfolios
Formal
Norm Referenced test, WISC-IV, K-TEA
Formal tests are more standardized.
Purpose of tests: Evaluate learning, Grading, Evaluating if objectives are met, and Evaluating instruction.
Scores used in testing and other measures
Scores are just a quantitative representation of a qualitative performance that could be represented qualitatively instead of quantitatively.
Raw Scores: the number of correct answers on a test.
Others scores that we used come from the raw score. The Raw Score is a base for us to then find news ways to interpret the data.
Derived scores: (often called standard scores too) are converted raw scores that have been adjusted and are reported relative to the populations they were taken from.
Scores can be compared when converted. (Standard score, t score, scaled score, V scaled, and Z scores
Standard Score: Mean: 100 SD:15
T Score: Mean: 50 SD: 10
Scaled Score: Mean: 10 SD: 3
V-scaled Score: Mean: 15 SD: 3
Z Score: Mean: 0 SD: 1
Converting Scores
Z Score: (x-Mean)/SD New Score: (Z*SD)+Mean
the standard Curve
In a standard curve you can see that there are 8 sections. The first section is less than 1%. Second is 2%. Third is 14%. The fourth and Fifth is 34%. The sixth is 14%. The sevetnth is 14%, and the eighth is Less than 1%.
If a student's tests scores fall in either of the 34% parts on the standard curve then they are considered average.
Validity
Content
Measures what content/curriculum was taught. These would be test that are given within the class. For example after a math unit you are then given a math test.
Criterion
These are tests that are related to the state standards. The test items should be correlated to the state standards. For example, the Praxis.
Construct
This is the theory behind the test. There is no certain outcome that one must obtain. An example of this test would be an IQ test.
Factors affecting validity are...
Test needs to be reliable
Is the test actually meaning the desired skill?
A test cannot be more valid than it is reliable.
Method of measurement
Enabling sates and behaviors. (Sensory abilities, Language, prerequisite skills, motivation)
Opportunity to acquire skills/behaviors
Norms
Differential item effectiveness
Rules to give valid tests...
Use multiple examiners
Multiple measures
Records, interviews, observations, tests
Multiples times and places
