Group 3
Type in the name of the third group and press Enter.
Double-click in the background to add items to this group, or in the overlaps between the groups.
Group 2
Type in the name of the second group and press Enter.
Double-click in the background to add items to this group, or in the overlaps between the groups.
Group 1
Type in the name of the first group and press Enter.
Double-click in the background to add items to this group, or in the overlaps between the groups.
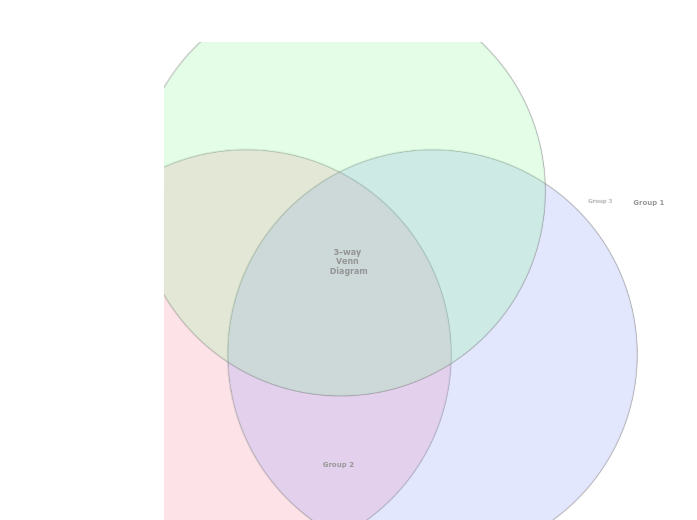
3-way Venn Diagram
A Venn Diagram compares items by assigning them to groups. An item can belong to:
- No group, if it is placed outside the circles
- One group only, if placed in one of the crescents
- Two groups, if placed in the overlap area between two groups
- Three groups, if placed in the overlap area of all three groups.
The item counts (and not the areas of the circles and their overlap) indicate the population of each group or the overlap between groups.


