ENTREPRENEURSHIP
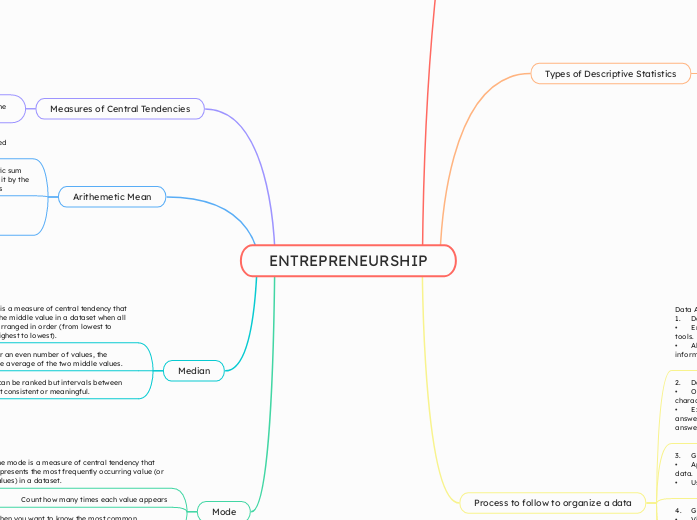
Descriptive Statistics
Consists of the presentation of numerical data using tables, columns, lines, circles, etc., which can now be prepared with the help of technological tools.
Types of Descriptive Statistics

COLUMN GRAPH

GRAPH IN LINES

GRAPH BY AREA
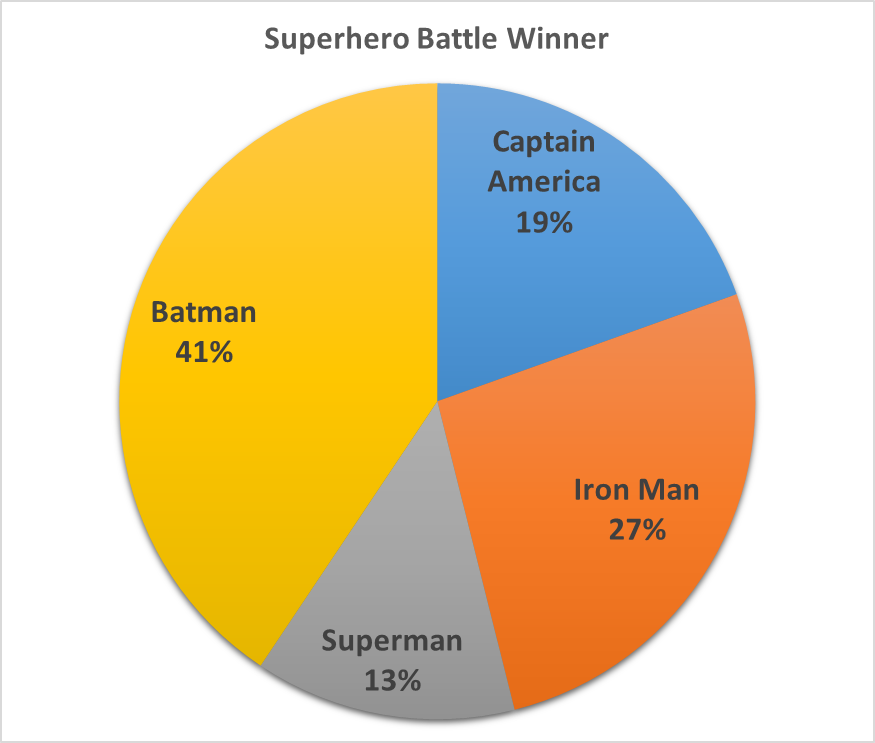
PIE CHART
Process to follow to organize a data
Data Analysis Process
1. Data Tabulation
• Encoding and transcribing data into electronic tools.
• Allows summarization and processing of information.
2. Data Grouping
• Organizing data based on common characteristics.
• Examples: geographic sectors, numerical answers, similar responses, open or closed answers.
3. Getting Results
• Applying mathematical operations to interpret data.
• Use of sums, trends, percentages, etc.
4. Graphic Representation
• Visually presenting results to facilitate analysis.
• Use of charts and diagrams.
Interpretation and Conclusions
5. The interpretation process involves analyzing patterns, identifying key concepts, and making informed decisions. While statistical methods help find trends over time, conclusions are not absolute truths, as variables can change. Effective decision-making requires experience, careful reflection, and discussion among experts.
Measures of Central Tendencies
They are statistical measures that seek to summarize, in a single value, a set of data
They represent an average center around which the values are located
Arithemetic Mean
Known as average, it is the most widely used measure.
It is obtained by carrying out that arithmetic sum of all the elements of a series and dividing it by the number of elements that the series contains
Example
1, 7, 3, 2, 6, 7, 7, 7
1+7+3+2+6+7+7+7 / 8 = 5
Is used when data distribution is relatively symmetrical
Median
The median is a measure of central tendency that represents the middle value in a dataset when all values are arranged in order (from lowest to highest or highest to lowest).
It is used for an even number of values, the median is the average of the two middle values.
1, 2, 3, 6, 7, 7, 7, 7
6+7 = 13 + 1 = 14 / 2 = 7
When data can be ranked but intervals between values aren't consistent or meaningful.
Mode
The mode is a measure of central tendency that represents the most frequently occurring value (or values) in a dataset.
Count how many times each value appears
1, 2, 3, 6, 7, 7, 7, 7
Mode: 7 (repeats 4 times)
When you want to know the most common outcome or response