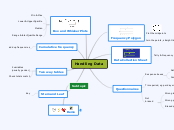
Handling Data

Frequency Polygon

Plot the midpoints
Join the points, straight lines
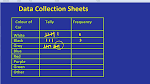
Data Collection Sheet
Tally & Frequency
Questionnaires
Response boxes
Not overlapping
Complete (more than)
Time period, eg per day or month
Not biased
Wrong location
Wrong people
Biased question or options

Box and Whisker Plots
Min & Max
Lower & Upper Quartile
Median
Range & Inter Quartile Range
Cumulative frequency
add up frequencies
Two way tables
2 variables
(usually gender)
Check totals match
Stem and Leaf
Key
