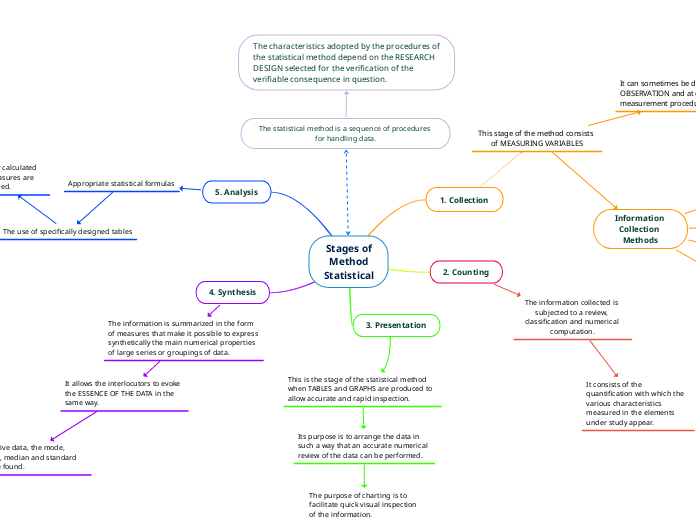
Stages of
Method
Statistical
1. Collection
This stage of the method consists of MEASURING VARIABLES
It can sometimes be done by simple OBSERVATION and at other times complex measurement procedures are required.
This step is essential because it depends on the availability of ACCURATE and RELIABLE data.
Such sampling procedures are subordinate to the verifiable outcome to be tested and the research design selected.
Information Collection Methods
Interview: is an interaction involving the researcher and a participant(s) in which questions are asked in person, by telephone, or even electronically. During an interview, questions are asked to obtain detailed information about the participant about the topic of study.
Observations: are records taken that do not require participation. These records are made while participants are engaged in routine behaviors and are used as an indicator of what participants do, rather than relying entirely on participants' accounts of their own behavior. An example would be a researcher observing the educational plans used in a classroom by a public school teacher.
Record Review: occurs when a researcher examines and extracts information from documents containing data about the participant. Records reviewed in a research study may be public or private. An example is a researcher collecting information about a condition from patients' medical records.
Survey: is a series of questions directed to research participants. They can also be administered to an individual or a group. Surveys are used to gather information about many people and may include multiple choice or open-ended questions (such as demographic information, health, knowledge, opinions, beliefs, attitudes, or skills).
2. Counting
The information collected is subjected to a review, classification and numerical computation.
It consists of the quantification with which the various characteristics measured in the elements under study appear.
3. Presentation
This is the stage of the statistical method when TABLES and GRAPHS are produced to allow accurate and rapid inspection.
Its purpose is to arrange the data in such a way that an accurate numerical review of the data can be performed.
The purpose of charting is to facilitate quick visual inspection of the information.
5. Analysis
Appropriate statistical formulas
The use of specifically designed tables
The previously calculated summary measures are reviewed.
It consists of COMPARISON.
4. Synthesis
The information is summarized in the form of measures that make it possible to express synthetically the main numerical properties of large series or groupings of data.
It allows the interlocutors to evoke the ESSENCE OF THE DATA in the same way.
For quantitative data, the mode, range, mean, median and standard deviation are found.
