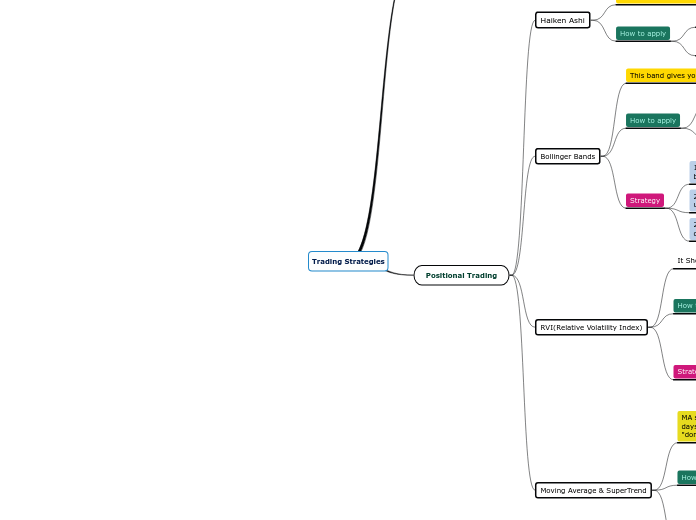
Trading Strategies
Intraday Trading
Positional Trading
Haiken Ashi
It shows average price for that timeframe and helps to read trend of trade.
How to apply
Go to in.tradingview.com
Instead of normal candlestick, select "Haiken Ashi"
Bollinger Bands
This band gives you volatility of that share
How to apply
Go to in.tradingview.com
Select "Bollinger bands" in Indicators X 2 times
Settings>Inputs
Std.dev=1
Change the band colors
Std.dev=2
Change the band colors
Strategy
1. Combine Haiken Ashi candles and Bollinger bands
2. When volatility band is narrow and share is in uptrend then "Buy" call is generated
2. When volatility band is narrow and share is in downtrend then "Sell" call is generated
RVI(Relative Volatility Index)
It Shows.......
How to apply
Go to in.tradingview.com
Select "Relative Volatility Index" in Indicators
Settings>Inputs
Set upper band to"70"
Set lower band to"30"
Strategy
1. When RVI is below 30 then "Buy" call is generated
2. When RVI is above 70 then "sell" call is generated
Moving Average & SuperTrend
MA shows average for the selected interval of days & SuperTrend shows line studied by "dominac"
How to apply
Go to in.tradingview.com
Select "Moving Average" in Indicators
Settings>Inputs
Set length as "20"
Select "SuperTrend" in Indicators
Strategy
1. The day at which price of share close above these 2 lines then "BUY" call is generated
1. The day at which price of share close below these 2 lines then "SELL" call is generated
