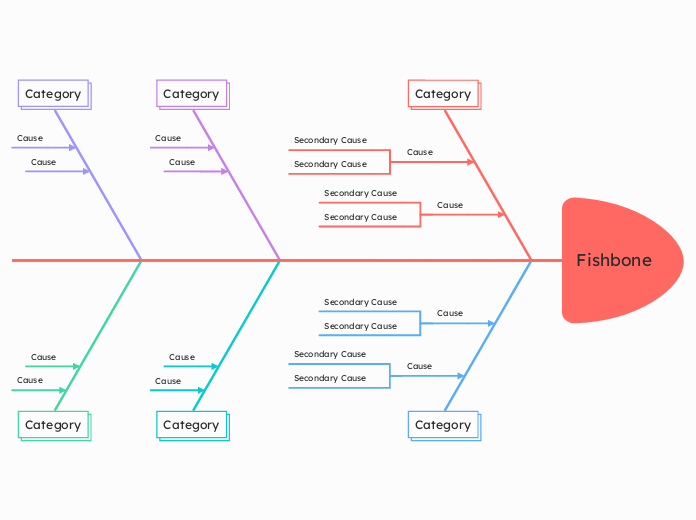
Fishbone
Category
Cause
Secondary Cause
Secondary Cause
Cause
Secondary Cause
Secondary Cause
Category
Cause
Cause
Category
Cause
Cause
Category
Cause
Secondary Cause
Secondary Cause
Cause
Secondary Cause
Secondary Cause
Category
Cause
Cause
Category
Cause
Cause
