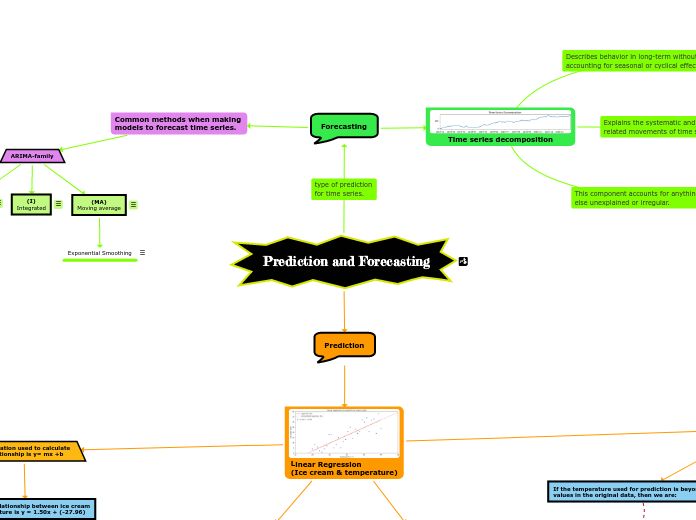
Prediction and Forecasting
Prediction
Linear Regression
(Ice cream & temperature)
Dependent variable
The quantity we want to predict
(Ice cream sales)
Independent variable
The variable we will use to predict it
(Temperature)
The equation used to calculate
the relationship is y= mx +b
The linear relationship between ice cream
and temperature is y = 1.50x + (-27.96)
ice cream sales = 1.50 x (temperature = x) -27.96
ice cream sales = 1.50 x (35) - 27.96
24.54 ice creams
Predictions
Temperature value used for prediction is within the range of original data points used to build regression
Making predictions from the solid portion of the line
If the temperature used for prediction is beyond the values in the original data, then we are:
Making predictions from the dotted portion of the line.
Trends don't continue indefinitely. If it is too hot people might not leave their A.C. cooled home, resulting in no sales.
Forecasting
Time series decomposition
Trend component
The population of Earth is increasing,
or the value of a stock is stagnating.
seasonality component
The number of ice cream trucks
is higher in the summer months.
cyclical component
Hurricane driving the number of ice cream trucks down in the short-term because it isn't safe to be outside.
Common methods when making
models to forecast time series.
ARIMA-family
(AR)
autoregressive
(I)
Integrated
(MA)
Moving average
Exponential Smoothing
