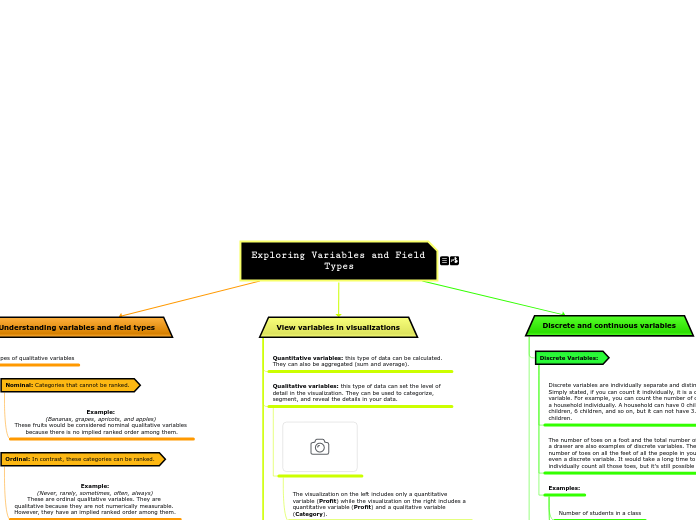
Exploring Variables and Field Types
Data scientist, Jeffrey Leek, defines data as being, "comprised of values of qualitative or quantitative variables, belonging to a set of items." In this module, you'll explore types of variables, and you'll learn how these variable types impact columns (or fields) of data.
Objectives
At the end of this module, you will be able to:
- Identify different types of variables.
- Distinguish among nominal qualitative, ordinal qualitative, and quantitative variables.
- Distinguish between continuous and discrete variables.
Discrete and continuous variables
Continuous Variables:
Volume of water in the Pacific Ocean
Mass of a semi truck
Air temperature
Other examples of continuous values include temperature, distance, and mass.
These are variables that cannot be counted in a finite amount of time because there is an infinite number of values between any two values. For example, if you want to measure time, every unit of time can be broken into even smaller units: The response time to a stimulus could be expressed as 1.64 seconds, or it could be further broken down and expressed as 1.642378765 seconds, and so on, infinitely.
Continuous means forming an unbroken whole, without interruption.
Discrete Variables:
Examples:
Number of eggs in a carton
Number of horses in South America
Number of students in a class
The number of toes on a foot and the total number of socks in a drawer are also examples of discrete variables. The total number of toes on all the feet of all the people in your city is even a discrete variable. It would take a long time to individually count all those toes, but it's still possible to do so.
Discrete variables are individually separate and distinct. Simply stated, if you can count it individually, it is a discrete variable. For example, you can count the number of children in a household individually. A household can have 0 children, 3 children, 6 children, and so on, but it can not have 3.45 children.
View variables in visualizations
View a visualization with a
second ordinal variable added
What do you notice? Surprisingly, for medium-priority orders, orders shipped first class have higher average shipping costs than orders shipped same day.
Adding a second ordinal variable enables us to analyze average shipping costs by both Order Priority and Ship Mode.
View a visualization with
an ordinal variable added
What do you notice? Surprisingly, low-priority orders have higher average shipping costs than medium-priority orders do.
Now let's see what happens when we explore another visualization, one that uses an ordinal variable to analyze average shipping costs by Order Priority.
View visualizations with
nominal variables added
The visualization on the right drills deeper down with the addition of the nominal variable Sub-Category. Now we can see that, even though Technology had the highest average shipping costs by product category, Tables have highest average shipping costs by product sub-category.
Let's begin with the nominal variables. With the Category dimension added, average shipping cost is now segmented by product category. We can see that the Technology product category has the highest average shipping costs.
View the visualization before
qualitative variables are added
We'll begin with a visualization that contains only one quantitative variable, and shows average shipping costs.
Take a closer look
at the qualitative variables
Order Priority and Ship Mode contain values that imply a logical rank or order. These are ordinal variables. This distinction will be important when we explore visualizations.
Category and Sub-Category contain value names without any implied rank or order. These are nominal variables.
Examine the variables
Profit, Sales, and Shipping Cost are quantitative variables.
Category, Order Priority, Ship Mode, and Sub-Category are qualitative variables.
Qualitative variables: this type of data can set the level of detail in the visualization. They can be used to categorize, segment, and reveal the details in your data.
The visualization on the left includes only a quantitative variable (Profit) while the visualization on the right includes a quantitative variable (Profit) and a qualitative variable (Category).
Quantitative variables: this type of data can be calculated. They can also be aggregated (sum and average).
Understanding variables and field types
Types of qualitative variables
Ordinal: In contrast, these categories can be ranked.
Example:
(Never, rarely, sometimes, often, always)
These are ordinal qualitative variables. They are
qualitative because they are not numerically measurable.
However, they have an implied ranked order among them.
Note: At times, ordinal values are given numeric equivalents (5 = Extremely satisfied, for example) and then are treated as quantitative values.
Nominal: Categories that cannot be ranked.
Example:
(Bananas, grapes, apricots, and apples)
These fruits would be considered nominal qualitative variables because there is no implied ranked order among them.

