PROJECT EVALUATION
It is a very useful tool for decision-making by financial managers, since an analysis that anticipates the future can avoid possible deviations and problems in the long term.
Evaluation methods or PRI (Recovery period of investment)
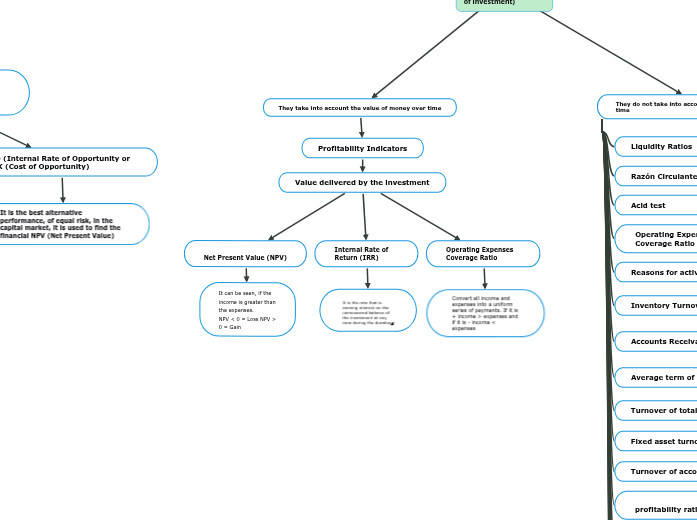
They take into account the value of money over time
Profitability Indicators
Value delivered by the investment
Net Present Value (NPV)
It can be seen, if the income is greater than the expenses.
NPV < 0 = Loss NPV > 0 = Gain
Internal Rate of Return (IRR)
Operating Expenses Coverage Ratio
Convert all income and expenses into a uniform series of payments. If it is + income > expenses and if it is - income < expenses
They do not take into account the value of money over time
Liquidity Ratios
Ability to pay short-term debts
Razón Circulante
current ratio
Acid test
Measures the liquidity of its most liquid assets with liabilities due to expire in the short term
Operating Expenses Coverage Ratio
Ability of the company to cover basic operating costs
Reasons for activity
Measures the efficiency of the company in the administration of its assets
Inventory Turnover
Accounts Receivable Turnover (RCC)
Represents the number of times that the commercial cycle is fulfilled in the period to which net sales refer
Average term of accounts receivable (PPCC)
Indicates the average period of time required to collect outstanding accounts
Turnover of total assets
Number of times investment in total assets has generated sales
Fixed asset turnover
Number of times the investment in fixed assets has been sold
Turnover of accounts payable (RCP)
Speed with which accounts payable have been created.
profitability ratios
Measures the success of the company in a certain time
Gross Profit Margin
Measures the proportion of sales that turn into profit or loss
return on investment
Measures the proportion of investments that turn into profit or loss
Return on Average Total Assets
Measures financial success of average total assets
coverage reasons
Helps assess the solvency of the company
debt ratio
Shows the percentage of the total investment in assets that has been financed by creditors
reason for stability
Relationship between total liabilities and stockholders' equity. If it is >1, it indicates that the company has leverage of more than 50%.
interest coverage
Measures the company's ability to cover interest payments on debts incurred
Added economic value
EVA = Operating Income - Capital Costs - Taxes
Added Market Value
MVA = Market Value of the company - Capital Invested to date
Interest-paying ability ratio
Project Free Cash Flow (FCL)
Methodologies
direct method
NOPAT method
EBITDA method
Operating profit + depreciation and amortization of intangibles
Shareholder Cash Flow
It is what the project leaves to the shareholder after covering its costs, paying its taxes, executing the necessary investments for the operation of the business and paying creditors.
Project value generation
The value is generated as long as the company or project delivers a higher return than the minimum rate that investors demand to place their funds in it.
WACC (The Weighted Average Cost of Capital)
It is the discount rate that should be used to determine the present value of a future cash flow.
TIO (Internal Rate of Opportunity or COK (Cost of Opportunity)
It is the best alternative performance, of equal risk, in the capital market, it is used to find the financial NPV (Net Present Value)
All updated revenues and costs must be added, using the WACC or COK as a discount rate, depending on whether the FCL or FCA is used, and then divide them, having a result for decision making and summarized as follows: BI/C > 1 approve (revenues greater than costs) =1 Approve and <1 reject (indicates that revenues are less than costs)
