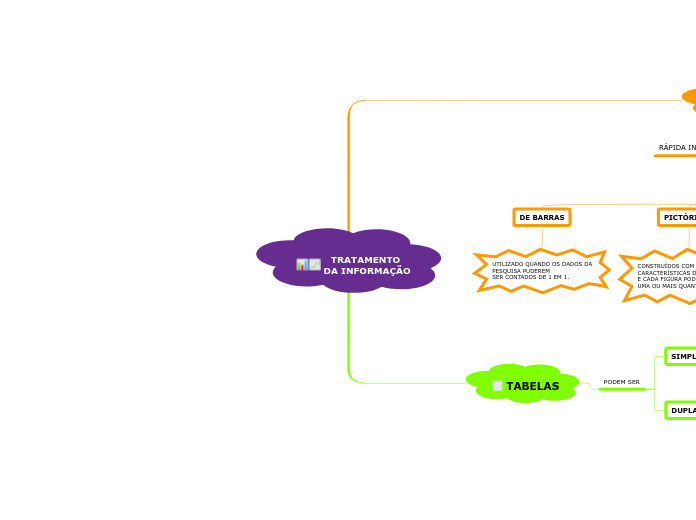
TRATAMENTO
DA INFORMAÇÃO
Express your feeling and opinions about the people in your life, the books you have been reading, the weather and your favorite food.
TABELAS
PODEM SER
What food you dislike the most?
DUPLA ENTRADA
MOSTRA 2 OU MAIS
TIPOS DE INFORMAÇÕES
SOBRE 1 ITEM DA PESQUISA.
SIMPLES
Why do you dislike this food?
How does it make you feel?
Try to come up with various descriptive adjectives that best describe the meaning of bad in this context.
disgustingrottenblandgreasynasty
APRESENTA
RELAÇÃO ENTRE
2 INFORMAÇÕES.
GRÁFICOS
RÁPIDA INFORMAÇÃO DOS DADOS COLETADOS
Who is the best person in the world for you? Type in the answer.
motherfathergrandfathersisterbrothergrandmotherbest friend
TIPOS DE GRÁFICOS
Describe the way he/she looks like.
Try to provide as many descriptive adjectives as you can, taking into account the meaning of good and nice in this context.
attractivehandsomegraciousstunningyouthful
DE SETORES
EVIDENCIA TENDÊNCIAS
DE UMA PESQUISA; COMUNICA
VISUALMENTE AS ESCOLHAS OU
PREFERÊNCIAS SOBRE
O QUE FOI PESQUISADO.
DE LINHA
INDICA A VARIAÇÃO DE UMA
QUANTIDADE AO LONGO DE
UM PERÍODO DE TEMPO.
PICTÓRICOS
CONSTRUÍDOS COM FIGURAS
CARACTERÍSTICAS DA PESQUISA
E CADA FIGURA PODE REPRESENTAR
UMA OU MAIS QUANTIDADES.
DE BARRAS
UTILIZADO QUANDO OS DADOS DA
PESQUISA PUDEREM
SER CONTADOS DE 1 EM 1.
