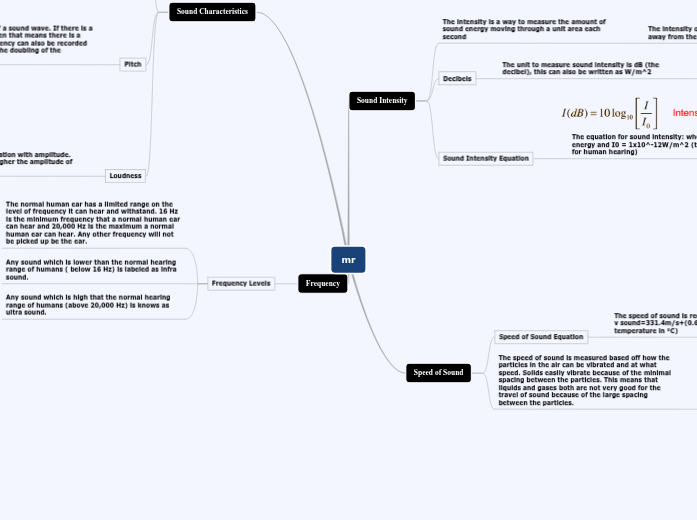
mr
Sound Intensity
The intensity is a way to measure the amount of sound energy moving through a unit area each second
The intensity of sound will decrease as you move away from the source of the sound energy
Decibels
The unit to measure sound intensity is dB (the decibel), this can also be written as W/m^2
The decibel scale is a logarithmic scale meaning 20 dB is 10 times greater than 10 dB and 30 dB is 100 times greater than 10 dB
Sound Intensity Equation
The equation for sound intensity: where I = sound energy and I0 = 1x10^-12W/m^2 (the threshold for human hearing)
Speed of Sound
Speed of Sound Equation
The speed of sound is recognized universally as; v sound=331.4m/s+(0.606m/s/°C)T (T = temperature in °C)
The speed of sound is measured based off how the particles in the air can be vibrated and at what speed. Solids easily vibrate because of the minimal spacing between the particles. This means that liquids and gases both are not very good for the travel of sound because of the large spacing between the particles.
The higher the temperature the faster sound can travel through air, this is because the particles in the air move faster allowing the air to vibrate quicker.
Sound Characteristics
Sound Characteristics
Sound quality come from the characteristics of the waveform attributed to it.
Overtones have rich sound characteristics and are not only more complex looking, but are more complex sounding than pure tone. Moist musical instruments have overtones which explains for the complex sounds. Sound with overtones is often found to be pleasant to the ears.
This is what overtones on two different stringed instruments (Piano and violin) in comparison to a pure tone graph.
Pure Tones are have simple sound characteristics
This is what a pure tone will look like when it is graphed.
Noise is when a waveform has no discreet pattern and when graphed looks as if random points have been plotted in random positions. Noise is often judged to be an unpleasant or unwanted sound. Unlike complex overtones.
This is an image of white noise, it is clear there is no pattern.
Pitch
Pitch is the frequency of a sound wave. If there is a high pitch to a sound then that means there is a higher frequency. Frequency can also be recorded as octave, an octave is the doubling of the frequency.
This photo shows the direct correlation between pitch levels and frequency levels.
Loudness
Loudness has a direct correlation with amplitude. The louder a sound is, the higher the amplitude of the sound is.
This map shows the different wave charts for a louder sound with higher amplitude and a quieter sound with lower amplitude.
Frequency
Frequency Levels
The normal human ear has a limited range on the level of frequency it can hear and withstand. 16 Hz is the minimum frequency that a normal human ear can hear and 20,000 Hz is the maximum a normal human ear can hear. Any other frequency will not be picked up be the ear.
Any sound which is lower than the normal hearing range of humans ( below 16 Hz) is labeled as infra sound.
Any sound which is high that the normal hearing range of humans (above 20,000 Hz) is knows as ultra sound.
