Шаблоны > Бизнес-анализ >

Break even analysis template

Break even analysis template

Find out how much money you need to start a business with a break-even analysis.

It will help you determine when your business will become profitable.

Keywords: business analysis, break-even analysis, profitability, variable costs, average price, fixed costs, data analysis

Break even analysis template

Break even analysis template

Use the break-even analysis template to calculate how much you will need to sell until you make a profit. See how total fixed costs, price, volume, and other factors affect your net profit.

Any company plans how to market and sell its goods or services to generate revenue. Every business owner should do a business plan when he starts the business.

Organizing finances is a part of a business plan. No other part of your business plan can be implemented without it.

Also, calculating the break-even point is the most important part of your financial organization.

This analysis is mandatory for any companies, strating from a small busines to big ones.

The Break-even analysis (also called cost-volume-profit CVP analysis) is a way to determine how changes in variable and fixed costs affect a firm's profit.

This template helps you find out what amount of sales, or units sold, is required to break even after incorporating all fixed and variable costs of running the operations of the business.

Instead of doing this analysis in Excel, you can use this template that is created especially for finding the fixed costs, the variable cost total, and the variable cost per unit. After you have learned more about them and figured out exactly what they are and how they are related to your business, the template helps you in calculating the break-even point.

The main difference between this template and analysis in Excel is that the template offers you an overview of the main things you should take into consideration when you are doing the break-even analysis. Also, unlike the analysis in Excel, it offers you an indication to realize this analysis.

Reasons to do a break-even analysis

Some of the reasons for using this template to do a cost volume profit (CVP) analysis are the determination of profitability, selecting the sale price required to break-even, and calculating the fixed and variable costs, and analyzing data.

1. Determine profitability

Total revenue

Revenue generation is one of the most important activities any business can engage in.

It is defined as a process by which a company plans how to market and sell its products or services, to generate income.

Profit vs. loss

The profit and loss statement is a financial statement that summarizes the revenues, costs, and expenses incurred during a specified period, usually a fiscal quarter or year.

2. Price goods or services

The Break-even analysis helps you price goods or services you are offering on the market.

Do some research and find competitor's sale price. Then try to establish your sale price.

3. Analyze the data

Analyzing the data helps you reduce the total fixed costs, reduce the variable costs per unit, and improve sales.

To calculate the net profit, you have to know the fixed and variable costs.

Reduce the total fixed costs

The success of a business rests on its ability to adjust and adapt to improve earnings.

Think about some ideas to reduce your overall fixed costs and add them to the template.

Reduce the variable costs per unit

Costs per unit detail how much you charge for each unit of an item sold.

Unlike fixed costs, costs per unit vary when production levels increase or decrease.

Think about some ideas to reduce the variable cost per unit.

Improve sales

To improve the sales in your business, focus on the customers and shift to increasing sales performance.

The sales price per unit is the amount a company charges for a single item of a product or use of a service. Setting the sales price per unit is an important decision for a business owner because it has a direct effect on sales volumes.

If you want to find the sales price per unit from the income statement, you have to divide sales by the number of units sold.

To monitor and control your selling costs or cost per unit, you need to determine the sales price per unit for each item from your company inventory.

Cost volume profit (cvp) analysis

Profit and loss are related to total revenue, costs, and expenses.

The total revenue is just the price multiplied by the number of units sold.

There are two types of costs that you can analyze using this break-even analysis template: fixed and variable costs.

Total fixed costs

Fixed expenses are those costs that do not fluctuate, like rent, insurance, dues or subscriptions, depreciation, salaries, and advertising. They remain constant throughout the payback period, regardless of the number of units sold.

You will need to find out what your net profit per unit sold is and divide your fixed costs by that number. This will tell you how many units you need to sell before you start earning a profit.

The payback period refers to the amount of time it takes to recover the cost of an investment. In other words, the payback period is the time until a business reaches the break-even point.

Examples of fixed costs are:

Rent or mortgage

Labor cost

Insurance

Property taxes

Interest

Advertising

Standing orders

License or membership fees

Average price

The average price of shares is the total amount invested by the total number of shares bought.

Variable costs

Variable cost total change as the quantity of the good or service that a business produces changes. In other words, variable costs change with the number of units sold.

Variable cost per unit is the production cost for each unit that is affected by changes in a firm's output or activity level.

Also, calculate the contribution margin. It tells you how much margin or profit is being earned from sales after subtracting the variable cost total to produce the units. It is calculated with the following formula: the sale price required to break-even minus the variable cost.

Before calculating the break-even sales, it is necessary to know the contribution margin. You can find the break-even sales if you divide the total fixed costs with the contribution margin.

Calculating the break-even point

The break-even point is the level of production at which the costs of production equal the total revenue for a product. In other words, after you reach the break-even point, any additional sales will generate profits.

Use this template to calculate it.

Moreover, a business is not only about profit, you need to track more data. Always take calculated risks and have in mind the safety and sustainability od your company. Thus, it is important to be aware of the margin of safety, which refers to how much the sales level can fall before your business reaches this break-even point.

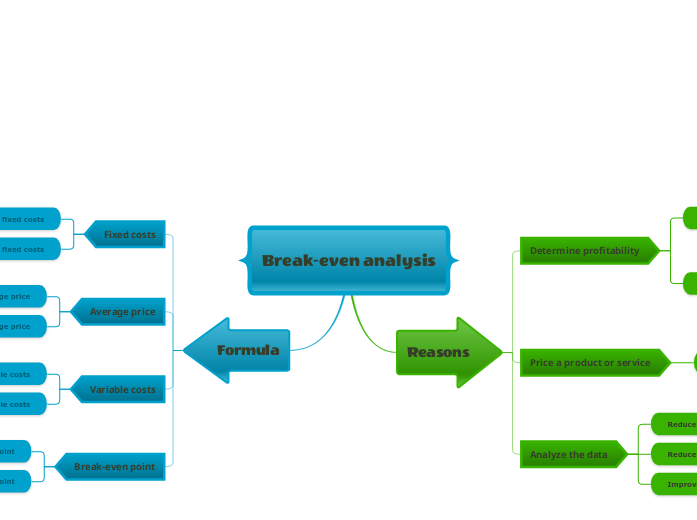
Break-even analysis

Starting any business has a price. Be prepared to cover those costs.

Formula

Use this formula to find the break-even point.

Fixed Costs / (Average Price – Variable Costs) = Break-Even Point

Break-even point
Determine break-even point

What is the break-even point?

The break-even point is the level of production at which the costs of production equal the revenues for a product.

Fixed Costs / (Average Price – Variable Costs) = Break-Even Point

Variable costs
Type variable costs

What are the variable costs?

Variable costs are costs that change as the quantity of the good or service that a business produces changes. Variable costs are the sum of marginal costs over all units produced.

Average price
Type average price

What is the average price?

To calculate the average purchase price of your shares you have to divide the total amount invested by the total number of shares bought.

Fixed costs

Fixed expenses or costs are those that do not fluctuate with changes in production level or sales volume.

They include such expenses as rent, insurance, dues and subscriptions, equipment leases, payments on loans, depreciation, management salaries, and advertising.

Type fixed costs

What are the fixed costs?

Fixed expenses or costs are those that do not fluctuate with changes in production level or sales volume.
They include such expenses as rent, insurance, dues and subscriptions, equipment leases, payments on loans, depreciation, management salaries, and advertising.

Reasons

Analyze the data

The Break-even analysis helps you analyze the data.

Improve sales

To improve the sales in your business, focus on the customers, and shift to increasing sales performance.

How can you improve sales?
Choose from the ideas below or add others.

Focus on the existing customersLearn about competitorsInnovation and unique productsCultivate valueBuild a customer service approachCustomer relationsPromotionMarketingProvide credible products
Reduce the variable costs per unit

How can you reduce the variable costs per unit?


Variable cost per unit is the production cost for each unit produced that is affected by changes in a firm's output or activity level.

Unlike fixed costs, these costs vary when production levels increase or decrease.

Reduce overall fixed costs

How can you reduce your overall fixed costs?


The success of a business rests on its ability to adjust and adapt to improve earnings.
Examples of fixed costs:

Price a product or service

The Break-even analysis helps you price a product or service.

Competitor name

Do some research and find competitor's prices.

Then try to establish your prices.

Price

What are the competitor's prices?

Determine profitability

The Break-even analysis helps you determine profitability.

Profit vs. loss

The profit and loss (P&L) statement is a financial statement that summarizes the revenues, costs, and expenses incurred during a specified period, usually a fiscal quarter or year.

Which products or services turn a profit and which ones are sold at a loss?

Generated revenue

Type idea

Revenue generation is one of the most important activities any business can engage in.
It is defined as a process by which a company plans how to market and sell its products or services, in order to generate income.

How much revenue do you need to generate to cover all your expenses?
Зачем использовать шаблон карты ума Mindomo?

Карты ума помогают проводить мозговые штурмы, устанавливать взаимосвязи между понятиями, организовывать и генерировать идеи.

Однако шаблоны mind map предлагают более простой способ начать работу, поскольку они представляют собой рамки, содержащие информацию о конкретном предмете с направляющими инструкциями. По сути, шаблоны mind map обеспечивают структуру, которая объединяет все элементы конкретной темы и служит отправной точкой для вашей личной mind map. Они представляют собой ресурс, обеспечивающий практическое решение для создания карты ума по определенной теме, будь то бизнес или образование.

Mindomo предлагает вам умные шаблоны карт разума, которые позволят вам работать и думать без усилий.

Шаблон обладает различными функциональными возможностями:

Описательные темы

Темы с фоновым текстом

Ветка по умолчанию

Удаление данных шаблона

Вы можете выбрать один из множества шаблонов ментальных карт из бизнес- или образовательных аккаунтов Mindomo или создать свои собственные шаблоны ментальных карт с нуля. Любую карту мыслей можно превратить в карту-шаблон, добавив к одной из ее тем дополнительные направляющие заметки.