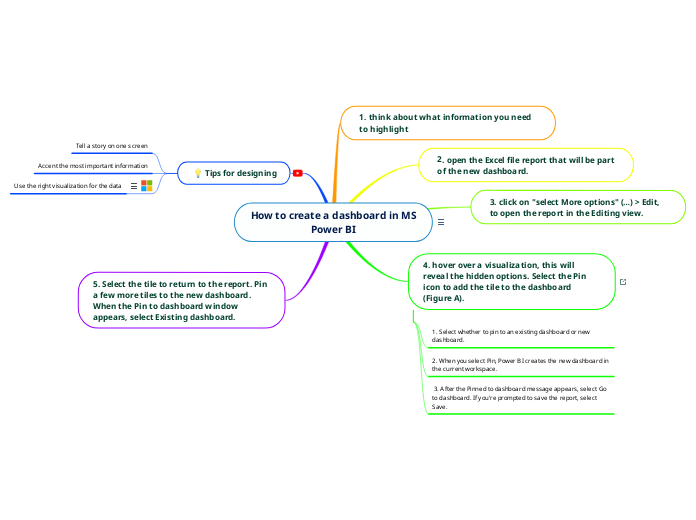
How to create a dashboard in MS
Power BI
What is a dashboard? It is, or it should be, a visual display of the most important information needed to achieve one or more objectives, consolidated and arranged in a single screen. Does this definition corresponds to a Power BI dashboard? Not necessarily, also a report can be a dashboard in this definition.
Regardless of its technical implementation, many dashboards fail to reach their goals and are merely decorative, even if they end up being ugly. And this latter issue, alone, is a good reason why a dashboard could be ignored.
5. Select the tile to return to the report. Pin a few more tiles to the new dashboard. When the Pin to dashboard window appears, select Existing dashboard.
💡 Tips for designing
Use the right visualization for the data
Avoid visualization variety for the sake of variety. Visualizations should paint a picture and be easy to read and interpret. For some data and visualizations, a simple graphic visualization is enough. Other data might need a more complex visualization. Use titles, labels, and other customization to help the reader.
- Be careful when you use visuals that are hard to read, such as 3D charts.
- Pie charts, donut charts, gauges, and other circular chart types aren't ideal data visualizations. Because humans can't compare values side by side, it’s harder to compare values in a pie chart than in bar and column charts. Pie charts are best if they have fewer than eight categories. Pie charts can be good for viewing part-to-whole relationships rather than for comparing the parts. Gauge charts are great for displaying the current status in the context of a goal.
- Be consistent with chart scales on axes, chart dimension ordering. Be consistent with the colors used for dimension values within charts as well.
- Be careful encoding quantitative data. Don’t exceed three or four numerals when displaying numbers. Display measures to one or two numerals left of the decimal point and scale for thousands or millions. For example, use 3.4 million not 3,400,000.
- Don’t mix levels of precision and time. Make sure that time frames are distinct and consistent. Don’t have one chart that has last month next to filtered charts from a specific month of the year.
- Don’t mix large and small measures on the same scale, such as on a line or bar chart. For example, don't mix one measure that's in the millions with another measure that's in the thousands. With such a large scale, it's difficult to see the differences of the measure that's in the thousands. If you need to mix, choose a visualization that allows the use of a second axis.
- Don’t clutter your charts with data labels that aren't needed. The values in bar charts are usually understood without displaying the actual number.
- Pay attention to how charts are sorted. If you want to draw attention to the highest or lowest number, sort by the measure. If you want people to quickly find a particular category within many other categories, sort by the axis.
Accent the most important information
Tell a story on one screen
4. hover over a visualization, this will reveal the hidden options. Select the Pin icon to add the tile to the dashboard (Figure A).
3. After the Pinned to dashboard message appears, select Go to dashboard. If you're prompted to save the report, select Save.
2. When you select Pin, Power BI creates the new dashboard in the current workspace.
1. Select whether to pin to an existing dashboard or new dashboard.
3. click on "select More options" (…) > Edit, to open the report in the Editing view.
2. open the Excel file report that will be part of the new dashboard.
1. think about what information you need to highlight

