作者:Juan Antonio Fernández-Arévalo 4 年以前
571
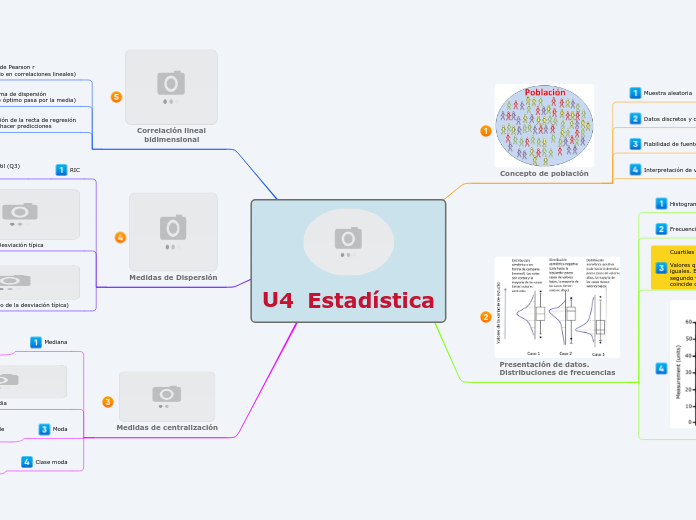
U4 Estadística y probabilidad

作者:Juan Antonio Fernández-Arévalo 4 年以前
571

更多类似内容
Use this mind map to plan and easily organize your lessons.
Plan and create the handouts your students will receive in order to support the day’s activities.
Help your students learn and practice the conversational techniques needed to move the discussion forward, with the discussion cards.
Add your printable worksheets meant to reinforce your students’ comprehension.
These could contain different types of exercises and even provide a quick overview of the day’s lesson.
Plan the activities your students will be involved in during the plenary session.
For example: a quiz, exit tickets, keyword bingo, RAG123, etc.
Having established the intention of your plenary session, it is now time to outline the objectives.
For example: clarify students' understanding, help students acquire different points of view, improve their critical judgment skills, promote free discussions, encourage students to ask questions, etc.
Set out the intention of this plenary session.
Outline all the information you will need in order to create your evaluation content, add notes and figure out what type of assessment will conclude your lesson (test, essay, presentation, etc).
After having graded and analyzed your students' work, establish what kind of feedback you will give them.
Will you have a discussion or will you give them written indications on the tests?
Will students need to review some of the content they didn't fully understand?
Try to evaluate your planned assessment and establish whether it's appropriate as evidence for the Student Learning Objective.
Establish your goals.
What do you want your students to achieve?
Here you should type in the timeframe of this class.
Starting date of the class.
Type in the title of your class.