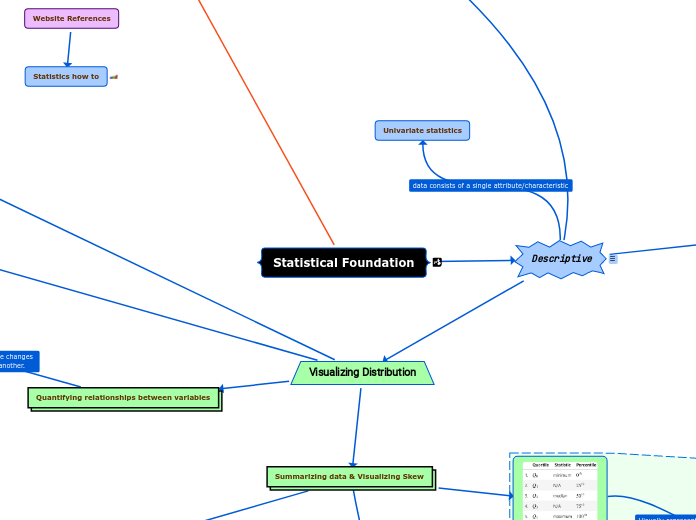
Statistical Foundation
Descriptive
Univariate statistics
Central Tendency
Mean
sample mean
Median
If n is even
Mode
Unimodal = 1 mode
bimodal = 2 modes
multimodal = many modes
Outliers
Tip
Measure of spread from the (MEAN)
Mean-based measures of dispersion
Variance
Standard Deviation
Coefficient of Variation (CV)
CV is the Ratio of the
standard deviation to the mean
Comparing Two Datasets
with different units problem
Comparing between parameters using relative units such as Celsius and Fahrenheit.
Median-based measures of dispersion
Interquartile range (IQR)
Quantiles
(25%, 50%, 75%, and 100%)
Quartile coefficient of dispersion
Range
Visualizing Distribution
Summarizing data & Visualizing Skew
5-number summary
Box plot (or box and whisker plot)
Tukey box plot
Histograms
Kernel density estimates (KDEs)

Continuous variables
(Heights or time)
Probability density function (PDF)
Rolling a 6-sided die can only result in 6 possible outcomes. (1,2,3,4,5, or 6) this is an example of a discrete variable because it isn't possible to role a 2.2 or 3.4 etc. On the other hand, a continuous variable such as height can end up being any number or fraction of a number between two discrete numbers. A persons hight can be 5"6" or 5"6.3" etc.
Both the KDE and Histogram
estimate the distribution.
Cumulative distribution function (CDF)
x-axis = the sorted data being measured
y-axis = evenly spaced data points with a maximum of 1
Cumulative Probability
Random Variable
Visualize Skew & Kurtosis
Kurtosis
Skew
Left (negative) skewed distribution
Right (positive) skewed distribution
No Skew
Common distributions
Poisson distribution
Exponential distribution
Uniform distribution
Bernoulli trial
Standard Normal (Z)
Binomial PMF - many Bernoulli trials
Quantifying relationships between variables
Covariance
Correlation
Pearson correlation coefficent
Perfect positive (linear) correlation
[as x increases y increases]
Scatter plot example of correlation
between x and y variables.
It is possible that there is another variable Z that causes both X and Y.
Perfect negative correlation
[as x increases y decreases]
Standardize data between two distributions
Scaling data
min-max scaling
Z-score
Resampling
simple random sample
stratified random sample
randomly pick preserving the
population of groups in the data
bootstrap sample
Resources For Bootstrap Information

