ER DIAGRAM แบบจำลองข้อมูล
Use this mind map structure to discover unseen connections, generate new ideas and reach a better understanding of any given subject.
Cardinality Constraints
ใช้แสดงถึงข้อกำหนดของความสัมพันธ์ระหว่าง entity แบ่งออกเป็นสองแบบคือ
Cardinality ratio
ใช้แสดงถึงอัตราส่วนของความสัมพันธ์ แทนที่ด้วยตัวเลข 1, M และ N
1 : 1 แทนความสัมพันธ์แบบหนึ่งต่อหนึ่ง
1 : N แทนความสัมพันธ์แบบหนึ่งต่อหลาย
M : N แทนความสัมพันธ์แบบหลายต่อหลาย
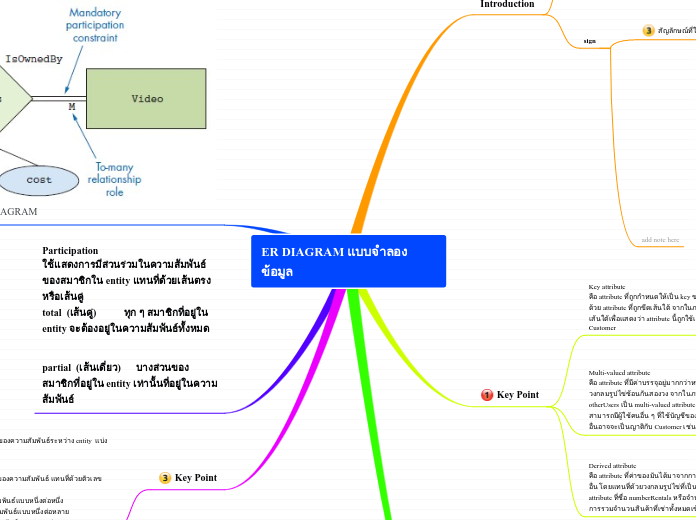
Participation
ใช้แสดงการมีส่วนร่วมในความสัมพันธ์ของสมาชิกใน entity แทนที่ด้วยเส้นตรงหรือเส้นคู่
total (เส้นคู่) ทุก ๆ สมาชิกที่อยู่ใน entity จะต้องอยู่ในความสัมพันธ์ทั้งหมด
partial (เส้นเดี่ยว) บางส่วนของสมาชิกที่อยู่ใน entity เท่านั้นที่อยู่ในความสัมพันธ์
In the conclusion you should have a brief summary of your key points.
ตัวอย่างของ ER DIAGRAM
Main topic
Key Point
The key points are the arguments which will support your thesis. These can be agreeing arguments or disagreeing arguments too, in each case they need to reflect on the main idea.
Derived attribute
คือ attribute ที่ค่าของมันได้มาจากการคำนวณของ attribute อื่น โดยแทนที่ด้วยวงกลมรูปไข่ที่เป็นเส้นประ จากในภาพ attribute ที่ชื่อ numberRentals หรือจำนวนที่เช่าซึ่งได้มาจากการรวมจำนวนสินค้าที่เช่าทั้งหมดเข้าด้วยกัน
Multi-valued attribute
คือ attribute ที่มีค่าบรรจุอยู่มากกว่าหนึ่งค่า โดยแทนที่ด้วยวงกลมรูปไข่ซ้อนกันสองวง จากในภาพ attribute ที่ชื่อ otherUsers เป็น multi-valued attribute หมายถึง Customer สามารถมีผู้ใช้คนอื่น ๆ ที่ใช้บัญชีของ Customer ได้ (ผู้ใช้คนอื่นอาจจะเป็นญาติกับ Customer เช่น ลูก, ภรรยา, น้อง)
Relationship Types
ใช้แสดงความสัมพันธ์ระหว่าง entity โดยแทนที่ด้วยรูปสี่เหลี่ยมข้าวหลามตัด ดังในภาพข้างล่าง Store Owns (เป็นเจ้าของ) Video (ในกรณีที่อ่านจากซ้ายไปขวา) หรือ Video IsOwnedBy (ถูกเป็นเจ้าของโดย) Store (ในกรณีที่อ่านจากขวาไปซ้าย) พึงสังเกตุว่าชื่อของ relationship types จะต้องเป็นคำกริยาเสมอ และความสัมพันธ์สามารถมี attribute ของตัวเองได้ เช่นในภาพ ความสัมพันธ์ Owns มี attribute คือ purchase Date และ cost
Key attribute
คือ attribute ที่ถูกกำหนดให้เป็น key ของ entity โดยแทนที่ด้วย attribute ที่ถูกขีดเส้นใต้ จากในภาพ account Id ถูกขีดเส้นใต้เพื่อแสดงว่า attribute นี้ถูกใช้เป็น key ของ entity Customer
Composite attribute
คือ attribute ที่สามารถแยกออกเป็น attribute ย่อย ๆ ได้หลาย attribute แทนที่โดยชื่อ attribute ใน วงกลมรูปไข่ที่มีเส้นตรงลากไปเชื่อมโยงกับ attribute หลัก จากในภาพ attribute ที่ชื่อ address สามารถแยกออกเป็น attribute ย่อยที่ชื่อ street, city, state, zipcode ได้อีก
Introduction
sign
State the main idea of the essay. This will be your thesis statement.
add note here
สัญลักษณ์ที่ใช้ในER DIAGRAM
Weak Entity
Associative Entity
Identifier
Attitude
Relation Line
Relationship
Entity
ER diagram คือ
In the introduction you should state the ideas what you want to defend along the essay.
แผนภาพเเสดงความสัมพันธ์ระหว่างข้อมูล (Entity Relationship Diagram)
แบบจำลองที่เเสดงให้เห็นข้อมูลและความสัมพันธ์ที่เกิดขึ้นในระบทั้งหมด
Subtopic
