Kategorier: Alle - continuous

af Alphonso Zoanetti 14 år siden

366

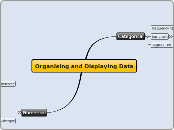
Organising and Displaying Data

Data organization involves categorizing and systematically displaying information to facilitate understanding and analysis. Categorical data can be represented using bar charts and segmented bar charts, while frequency tables help in summarizing such data.
Organising and Displaying Data

Organising and Displaying Data

Numerical

continuous

data that can be measured. (decimals)

dot plots - (small to medium size data sets)

(back to back) stem leaf plots - small to medium size data sets

spread

range

centre

middle

shape and outliers

negatively skewed

symmttrical

positively skewed

discrete

histogram

grouped data

interval size??

Categorical

segmented bar chart
bar chart
Subtopic
frequency table
ungrouped data