Kategorier: Alle - protein - sugar - diabetes

af EMIR OZDEMIR 1 år siden

114

Urinalysis Flow Chart

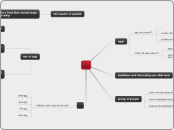
The text describes a detailed analysis of urine samples using various chemical tests to detect the presence of different substances. The first test involves using blue litmus paper, which turns red, indicating an acidic sample.

Urinalysis Flow Chart

We tested the sample with litmus paper in order to find out the pH levels. We used blue litmus paper and observed change in color to red which indicates that the sample is acidic.

We tested out the sample with biurets solution in order to identify any traces of protein. After adding Biurets solution to the sample we observed color change into purple which indicates the presence of protein inside urine.

After testing the sample adding Benedicts solution and putting it inside a hot bath, we observed color change to orange on the sample which indicates the presence of sugar inside urine.

The sample we observed was more diluted than the other samples. For that reason we identified the sample as Diabetes Insipidus.

Athlete with lactic acid in urine

Are there any traces of lactic acid?

Add your text

Brights Disease

Are there any traces of protein

Diabetes Mellitus

No

Yes

Are there any traces of sugar?

Urinalysis Flow Chart

Urine Samples X, W, Y, Z

Is The Urine Diluted?
Diabetes Insipidus