Diagram
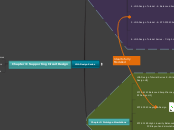
Methods to collect and analyze data
Mixed Methods
Collect/Analyze
Integration can occur at multiple levels:
1.The design level with the use of a sequential design
2.The level of interpretation, connecting qualitative and quantitative data.
3.Samples from the qualitative interviews were compared and contrasted with the results of the statistical analyzes of the survey data.
Quantitative
1. SPSS version 22 a descriptive and inferential analysis 2. Chi-square and Fisher´s exact test 3. Cross tabulations
1. Descriptive statistics 2. Inferential statistics
1. Census sampling (Survey)
Nominal, ordinal and interval item scores
Quanlitative
Analyze
1. Coding and thematic analysis 2. Hyper RESEARCH
1. Descriptive statistics 2. Coded text 3. Analytic memos
Collect
1. Census sampling 2.Purposeful sampling (Semi-structured)
Instruments
1. Transcripts 2. Field notes 3. Documents
Participants
1. UVM professors and researchers 2. 41 people in phase one (Qualitative) 3. 319 people in phase two (Quantitative)


