Understanding these inequalities are not effectively captured through dominant models that focus on individuals and/or homogenous groups.
How hierarchies of race, class, gender, disability, sexuality generate structural inequalities for particular groups can be understood through an 'Intersectional' Approach.
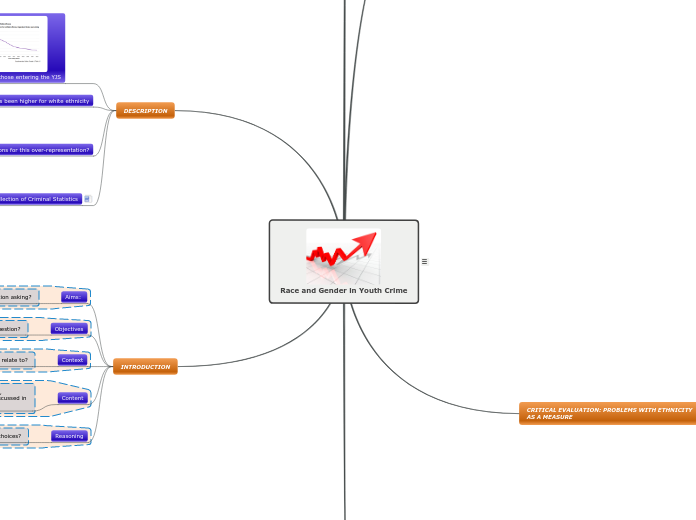
Race and Gender in Youth Crime
This map relates to section B of the exam, specifically question 4-Race and Gender in Youth Crime. The question covers a number of central concerns. These are:
- Official statistical data indicates certain sections of society have higher incidents of offending and victimization rates.
- Over-representation of young men and ethnic minorities in the youth justice system.
Therefore the question will require you to provide a comprehensive review of the need for, and use of, intersectionality in the study of youth crime, criminality, and the criminal justice system.
Argument:
- Recognising the disparities/differences in treatment in the youth justice system.
- Recognising how hierarchies of race, class, gender, disability, sexuality generate structural inequalities for particular groups.
Understanding these inequalities are not effectively captured through dominant models that focus on individuals and/or homogenous groups!
.
INTRODUCTION
Reasoning
What was the reasoning behind these choices?
Content
What/Which research, studies, philosophies, theories, evidence have you analysed, evaluated, explored, discussed in an attempt to answer the question.
Context
In what context does the question relate to?
Objectives
How might you answer the question?
Aims:
What is the question asking?
DESCRIPTION
Methods of Collection of Criminal Statistics
the main sources of data consist of official and unofficial reports achieved through recorded and unrecorded crime
Possible reasons for this over-representation?
Legacy of racialisation and criminalisation
Marginalisation by age, school climate, place and employment.
Rise in the criminalisation of Asian youth (1990’s)
Over-policing consisting of harassment and criminalisation of black youths (1980’s)
Rate of reduction has been higher for white ethnicity
Therefore, increasing the overall percentage and representation of BMAE in the YJS
Reductions in those entering the YJS
Reductions in the rates of arrests, cautions and FTE's
This can be evidenced by the latest Youth Justice data
CONCLUSION
SOCIAL
This occurred in parallel with heightened public concern regarding knife crime and youth violence but only this time, the focus is specifically on BMAE young men as opposed to young people generally.
Wider factors such as the media, public opinion and political rhetoric, contribute to risk averse court, probation and parole decisions and hence play a role in unnecessary focus on BMAE young men.
Attention is still bring paid to the perceived problem of youth
POLITICAL
What has remained high in this period is 'noise' about youth crime with high levels of public anxiety, media scrutiny and political debate.
It is hard to disentangle this noise and the legal activity generated by the system response from objexctive measures. Political deabte about youth crime has therefore created the problem it tries to address.
POLICY LEVEL
Are the recent trends encouraging signs that the Government’s recent interventions are making a difference to youth crime?
However, this reveals a racialised focus within current youth justice.
Represent a clear manifestation of increased diversion from formal criminal justice responses and a reduced reliance on child incarceration consistent with the evidence base.
CRITICAL EVALUATION: PROBLEMS WITH ETHNICITY AS A MEASURE
Lack of an intersectional approach with Criminology
Parmar (2017)
Disproportionate outcomes are reiterated without further discussion/analysis as to why?
Lack of discussion around the racializing consequences of the CJS.
An unwillingness to engage with race.
Intersections
No consideration of how the variables of ‘ethnicity’ and ‘gender’ intersect in the youth justice system specifically, or the criminal justice system generally.
Class/socio-economic status
Age
Culture/cusotms
Language
Abilities
Religion
Heterogeneity
The use of the category ‘ethnicity’ obscures underlying differences between individuals.
As Gilroy (1993) suggests, ethnicity has become a euphemism for ‘race’
does not account for internal homogeneity/heterogeneity
does not consider the fluidity of ethnicity/identity
OPPORTUNITY FOR THEORETICAL ANALYSIS:
Intersectionality
Intersectionality has since become an analytical tool for looking at how different power structures interlink, function and impact on peoples’ experiences :
The theory examines how different types of oppressions interact and impact people’s lives.
It's not about who is more oppressed than who or how many liberation groups you define into:
- Due the complexity of our identities, it's perfectly plausible and common for people to be privileged in some areas and oppressed in others.
- It is important to acknowledging that people experience things differently.
Allows for an examining oppression at the intersections of 'ethnicity' and 'gender' at the homogeneous and heterogeneous
The Effects of Poverty and Prison on British Muslim Men Who Offend
Webster and Qasim (2018) examines the links between their social and economic relations and their prison experiences, desistance, and identity.
On the face of it, this may seem a surprising finding, given an often-argued link between experiences of social and economic marginalization, ethnic and religious discrimination, and the likelihood of criminal involvement. It is, rather, that although the research population reported being discriminated against as non-white Muslims, this was something they shared generally with law-abiding members of their ethnic group, and discrimination alone did not drive their criminality.
Hence the need for an 'Intersectional' approach.
social and economic relations drove criminal solutions, not ethnicity.
This lead them to reject licit wage labour and embrace illicit entrepreneurial criminality.
An intergenerational shift from the availability of local high-waged, skilled, and secure textile work to low-waged, precarious, service work presented them with a series of problems and opportunities,
Impact of these layers of oppression young people experience:
Ethnicity:
Intra and inter-ethnic difference/similarities
Gender:
Intra and inter-gender difference/similarities
Age:
Intra and inter-generational difference/similarities
layers of oppression young people experiencing:
Ages and Class Discrimination
Labelling Consequences
Cultural Barriers
Biased Practices
Racist Attitudes
CRITICAL ANALYSIS: Gateway to the Youth Justice System
TREATMENT OF BAME ACROSS THE CJS
Critique
Bridges (2017) suggests the review:
“produces snapshots of marginal disproportionality at selected stages in the process and hence an episodic analysis of criminal justice, rather than looking at the overall system’s effect in producing differential outcomes for the various ethnic groups” (2017:80).
The Lammy Review (2017):
while the differential rate of arrest as between white and BAME adult males was 1 to 1.75.
For every 100 young white males arrested in 2014 there were 135 arrests of BAME young males (disproportionality rate of 1.35),
EVIDENCE TO THE CONTRARY
The recent and sustained reduction coming into contact with the youth justice system has not been experienced by all ethnicities:
The Relative Rate Index (RRI)is used as a measure of the relative difference in rates of the occurrence of an event or incident type, between different ethnicities. In this instance, the base rate is the rate of arrests of White children per 10,000 of the general 10-17 White population . The black line shown represents an RRI of 1, which would be the RRI if other ethnicities had arrest rates equal to those of White children.
The shaded box represents the ‘zone of tolerance’. Only where the RRI is outside this zone do we consider the difference in arrest rates between White children and those of another ethnicity to be statistically different. The RRI for each of these ethnicities
increased over the last year showing some ethnic disproportionality in arrests, which is often the first interaction a child will have with the justice system. This disproportionality is carried through the YJS and could be a driver of disproportionality seen at later stages of the system.
FTE's by Ethnicity
14,400 first time entrants (FTEs) to the Youth Justice System (YJS)- falling by 86% since the year ending March 2008, with a 14% fall since the year ending March 2017 for all ethnicities (except for FTEs from an Other ethnic background which increased from the year ending March 2016 to 2017 before falling again in the most recent year).
While the number of FTEs from a Black background has decreased since the year ending March 2008, the proportion they comprise of all youth FTEs has doubled, from 8% to 16%.
The number of FTEs has fallen for both males and females over the last decade, with females experiencing the largest percentage decreases.
The proportion of FTEs from an Asian background has increased from 4% to 7% over the same period, whereas FTEs from an Other ethnic background has remained stable, at 1%.
Cautions by Ethnicity
Although there has been year on year falls in the number of youth cautions given to both White and BAME children and young people- the number of youth cautions fell by 24% for White children and young people and 10% for BAME children and young people in the most recent year.
The overall the proportion of youth cautions given to BAME and White children and young people is similar to the proportions in the general 10 – 17 year old population. However, males received 78% of all youth cautions given despite only making up 51% of the general 10 – 17 year old population.
while remaining broadly stable for Asian and Other children. Like arrests, all ethnicity groups have seen decreases in the actual number of youth cautions issued over the course of the decade.
However, the reduction was lower for Black children which has led to an increase in the proportion of cautions Black children receive, from 6% to 11% over the last decade
Arrests by Ethnicity
In the report, ‘ethnicity’ is generally reported as Black, Asian and Minority Ethnic (BAME) and White.
69% of arrests were of White children (decrease from 83% ten years previously)
Arrests of Black children accounted for 16% in the latest year (double the proportion of ten years ago)
Arrests of Asian and Mixed children made up 6% and 7% of the total respectively in the latest year
YOUTH JUSTICE
The Gateway to the Youth Justice System looks at the number of arrests and youth cautions given to children and young people aged 10 – 17 Source: Arrests: Annual data collection from police forces Youth Cautions:
Recent and sustained reduction coming into contact with the youth justice system has been something experienced across all jurisdictions within the UK
In the year ending March 2018:
14,400 first time entrants to the YJS- fallen by 86% since the year ending March 2008, with a 14% fall since the year ending March 2017.
Youth Justice Statistics, England and Wales, April 2017 to March 2018:
Looks at the Youth Justice System (YJS) in England and Wales for the year ending March 2018 in terms of the number of children (those aged 10-17) in the system, the offences they committed, the outcomes they received, their demographics and the trends over time. The YJS in England and Wales works to prevent offending and reoffending by children. The YJS is different to the adult system and is structured to address the needs of children.
Sources:
•Home Office,
•Ministry of Justice (MoJ),
•Youth Offending Teams (YOTs)
•Youth secure estate providers.
•
Lancashire could not supply data for the years ending March 2017 and March 2018. Data have been removed for this force for all years so valid comparisons can be made. In the years for which data were available, figures show Lancashire’s arrest numbers contributed between 2% and 4% of the total.
Subtopic
26,700 children and young people were cautioned or sentenced- fallen by 82% over the last ten years, with a 6% fall in the last year.
There were over 65,800 arrests of children (aged 10-17) by the police in England and Wales (excluding Lancashire)- decrease by 78% over the last ten years, with a decrease of 8% in the last year.


