Kategorien: Alle - median - distribution

von Alphonso Zoanetti Vor 14 Jahren

322

Summarising Numerical Data

Understanding numerical data distribution involves several key statistical concepts. A box plot is a graphical representation that shows the minimum, maximum, median, quartiles, and potential outliers in a dataset.
Summarising Numerical Data

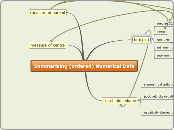
Summarising (ordered) Numerical Data

measure of centre

measure of spread

distribution shape

negatively skewed distribution
short left hand whisker
mediam to the left
positively skewed distribution
short right hand whisker
median to the left
symmetric distribution

box plot

maximum value
minimum value
quartiles
Q1, Q2,Q3,Q4

interquartile range

outliers

range
median (Q2)