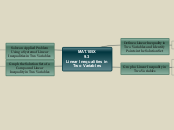
MAT.105X
9.3
Linear Inequalities in Two Variables
Graph the Solution Set of a Compound Linear Inequality in Two Variables
Steps
1. Graph each inequality separately on the same axes. Shade lightly.
2. If the inequality contains and, the solution set is the intersection of the shaded regions. Heavily shade this region.
3. If the inequality contains or, the solution set is the union (total) of the shaded regions. Heavily shade this region.
Solve an Applied Problem Using a System of Linear Inequalities in Two Variables
Linear programming problems are optimization problems that can involved systems of linear inequalities in two variables.
The system of linear inequalities in a linear programming problem are called constraints.
The graph of the solution set of the constraints is called the feasible region. It represents all of the potential solutions to the linear programming problem.
Graph a Linear Inequality in Two Variables
Slope-Intercept Method
1. Write the inequality in the form y >= mx + b (y > mx + b) or y <= mx + b (y < mx + b).
2. Graph the boundary line, y = mx + b.
If the inequality contains >= or <=, make it a solid line.If the inequality contains > or <, make it a dotted line.3. Shade the appropriate side of the line.
If the inequality is in the form y >= mx + b or y > mx + b, shade above the line.If the inequality is in the form y <= mx + b or y < mx + b, shade below the line.Test Point Method
1. Graph the boundary line. If the inequality contains >= or <=, make it a solid line. If the inequality contains > or <, make it a dotted line.
2. Choose a test point not on the line, and shade the appropriate region. Substitute the test point into the inequality.
If it makes the inequality true, shade the side of the line containing the test point. All points in the shaded region are part of the solution set.If the test point does not satisfy the inequality, shade the other side of the line. All points in the shaded region are part of the solution set.Easy Test Point
If (0, 0) is not on the boundary, it is an easy point to test in the inequality.
Definitions
A straight line divides the coordinate plane into two half planes.
The line is the boundary between the two half planes.
Define a Linear Inequality in Two Variables and Identify Points in the Solution Set
Solutions
Solutions to linear inequalities in two variables are ordered pairs of the form (x, y) that make the inequality true.
The solution set for a linear inequality in two variables is best represented by a graph.
Definition
A linear inequality in two variables is an inequality that can be written in the form Ax + By > C or Ax + By < C, where A, B, and C are real numbers and where A and B are not both zero. (>= and <= may be substituted for > and <.)
