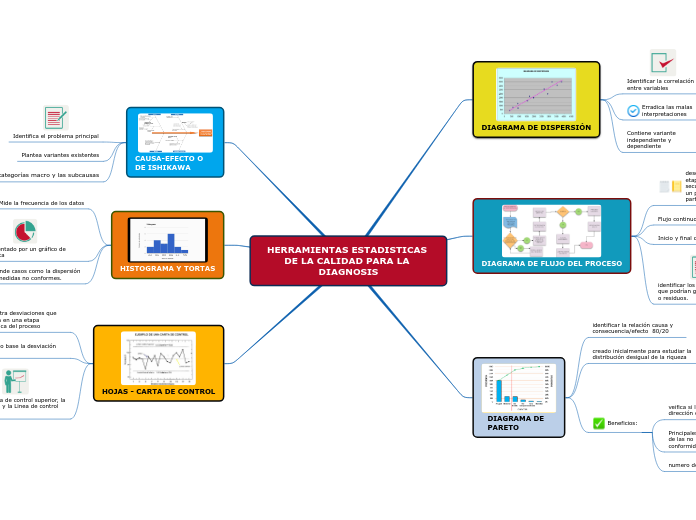
HERRAMIENTAS ESTADISTICAS DE LA CALIDAD PARA LA DIAGNOSIS
'Six Thinking Hats' can help you to look at problems from different perspectives, but one at a time, to avoid confusion from too many angles crowding your thinking.
HOJAS - CARTA DE CONTROL
The Yellow Hat will help you to think positively. While you are 'wearing' this hat be optimistic, notice the benefits and the value in them.
Tiene la Linea de control superior, la Linea central y la Linea de control inferior
aplica como base la desviación estándar
encuentra desviaciones que ocurren en una etapa específica del proceso
HISTOGRAMA Y TORTAS
The Green Hat represents creativity. Develop creative solutions to any problem with this hat. This unconstrained mindset allows you to freely test out a variety of useful creativity tools, due to its low level of criticism.
comprende casos como la dispersión de las medidas no conformes.
está representado por un gráfico de barras o torta
Mide la frecuencia de los datos
CAUSA-EFECTO O DE ISHIKAWA
The Blue Hat thinking represents process control. When having trouble because ideas are needed, the Green Hat may come in handy since it is the one used for creativity. In case of emergencies and dealing with them, the Black Hat is required.
categorías macro y las subcausas
Plantea variantes existentes
Identifica el problema principal
DIAGRAMA DE PARETO
Using the Black Hat you consider the negative outcomes. Find what would not work and why. This way you highlight the weak points in a plan. Black Hat will help you to identify the flaws and risks before you embark on a course of action.
Beneficios:
numero de problemas
Principales causas de las no conformidades
veifica si los esfuerzos van en la dirección correcta
creado inicialmente para estudiar la distribución desigual de la riqueza
identificar la relación causa y consecuencia/efecto 80/20
DIAGRAMA DE FLUJO DEL PROCESO
Using the Red Hat, you will use your intuition and emotions. Also, you will consider how others might look at the problem emotionally. Try to understand the responses of people who do not fully know your reasoning.
identificar los fallos o problemas que podrían generar retrabajos o residuos.
Inicio y final de un proceso
Flujo continuo de la información
describir las etapas y pasos secuenciales de un proceso en particular
DIAGRAMA DE DISPERSIÓN
Using the white thinking hat, you center your attention around the available data. Take the information that you have, analyze it, and see what you can learn from it. Become aware of your weak points and start working on improving your knowledge.
Contiene variante independiente y dependiente
Erradica las malas interpretaciones
Identificar la correlación entre variables
