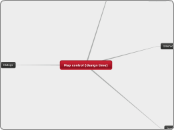
Map control (design time)
Dialogs
Point marker type properties
Point size rule properties
Point color rule properties
Line width rule properties
Line color rule properties
Line properties
Polygon color rule properties
Polygon center proint marker type properties
Polygon center point size properties
Polygon center point color rule properties
Polygon center point properties
Tile Layer Properties
Point Layer Properties
Line Layer Properties
Polygon Layer Properties
Base Layer data properties
Filters
Analytical data
General (spatial data source, spatial fields)
Embedded shape properties (individual shape, data field values)
Point
Line
Polygon
Embedded center point properties
Color Scale properties
Action
Number
Labels
Distance Scale properties
Legend properties
Action (interactivity)
Style
General
Title properties
Action properties
Visibility
General (text, aligment, position, angle)
Map viewport properties
Style properties
Optimization
Center and Zoom (4 different modes)
General (coordinate systems, boundaries)
Map properties
Border Skin
General item properties
Property grids
Interactivity in Designer
Changing viewport center and zoom via mouse
Geometry shapes selection
Map titles editing
Polygon layers adorner
Changing viewport center and zoom using special UI
Managing of layer visibility
Managing the list of layers
Layout changing (drag&drop) for all MapSubItems
Map Wizard
Map Preview
Theme and data visualization step
Analytical data visualization
Bubble size rule
Color rule
Map border skin visualization (themes)
Map visualization step
Analytical Data source step (optional)
Field match step (between analytical and spatial data)
Map view options step
Data embedding
Resolution
Tile layer (Bing)
Viewport center/zoom
Cropping
Data Source step
SQL Server spatial query
Data Set, Data Source, Query designer steps
Esri shapefile
Map gallery (WKB)
