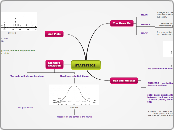
STATISTICS!
Standard Deviation
Used to create Bell Curve
Measure of the center is the MEAN
*Formula will always be given
But just incase...
Line Plots
Quartiles: Divide the data set into four sections.
Each section containing about 1/4 of the data.
QU: The upper quartile, find the median of the upper set of data points
QL: The lower quartile, find the median of the LOWER SET of data points.
Box and Whisker
OUTLIERS- How to figure out if numbers in a set of data are outliers:
IQR= Inter Quartile Range or, the distance between the lower quartile and the upper quartile. To be an Outlier, the number must be at least 1.5 X IQR.
Example: The Lower quartile is 13 and the Upper Quartile is 17... The IQR is 4. 1.5 X 4 = 6. So for a number in the data set to be an Outlier it must be +/- 6 from the quartiles.
Subtopic
Remember to include a
number line underneath
(to keep things evenly
spaced and to scale)
Be careful of SKEWING or SKEWED data!!
The Three Ms
MODE
The number that occurs the MOST in a set.
You CAN have more than one mode.
MEDIAN
The Middle Number. Order your numbers
from least to greatest, then find the middle number.
MEAN
Average- Add the numbers in your set and divide by
the amount of numbers in your set. Combine and divide
out equally.