GRAPHIC ORGANIZER
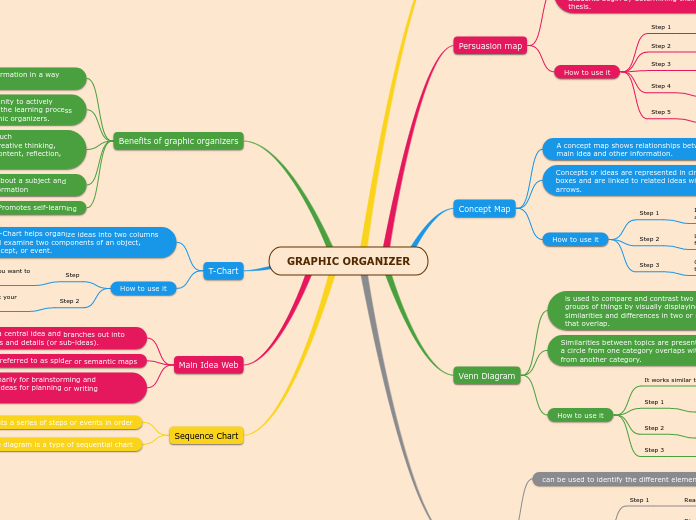
Sequence Chart
A cycle diagram is a type of sequential chart
represent a sequence of stages, tasks, or events in a circular flow.
presents a series of steps or events in order
Main Idea Web
is used primarily for brainstorming and generating ideas for planning or writing purposes.
referred to as spider or semantic maps
starts with a central idea and branches out into related ideas and details (or sub-ideas).
T-Chart
Write down facts on each column as you carry out your brainstorming.
Step
Draw a T chart and write down the two areas you want to brainstorm around on each column head.
A T-Chart helps organize ideas into two columns and examine two components of an object, concept, or event.
Benefits of graphic organizers
Promotes self-learning
Help recall prior knowledge about a subject and quickly connect it to new information
Help develop cognitive skills such asbrainstorming, critical andcreative thinking, categorizing and prioritizing content, reflection, etc.
Provide students the opportunity to actively contribute and participate in the learning process through the creation of graphic organizers.
Help visualize or present information in a way that is easier to comprehend
Story map
Once the map is complete you can discuss each element individually.
You can fill the story map during the discussion
These could be the characters, setting, problem and solution, etc.
Discuss the different significant elements that were involved in the story.
Read the book and understand it well.
can be used to identify the different elements
characters, character plots, themes, techniques, etc.
Venn Diagram
List the similarities in the common area.
Write down the differences or unique characteristics inside its own sector avoiding the overlapping area.
Write down the topics being compared on the top of each circle.
It works similar to the double bubble map.
Similarities between topics are presented where a circle from one category overlaps with a circle from another category.
is used to compare and contrast two or more groups of things by visually displaying their similarities and differences in two or more circles that overlap.
Concept Map
Connect these with lines to show how they are connected to each other.
List down the second layer of sub-elements stemming from the first component you have identified.
Identify the most important element under the topic you are studying.
Concepts or ideas are represented in circles or boxes and are linked to related ideas with arrows.
A concept map shows relationships between the main idea and other information.
Persuasion map
How to use it
Step 5
End your persuasion map with the conclusion of your essay.
Step 4
Then write down facts, examples, and information to back up your reasoning.
Step 3
Next to it, write down the reasons for making that claim.
Step 2
Define the claim that you want to make with your essay
Step 1
Choose a topic of interest for your essay/debate.
The Persuasion Map is an interactive graphic organizer that enables students to map out their arguments for a persuasive essay or debate. Students begin by determining their goal or thesis.
are visual and graphic displays that organize ideas and demonstrate relationships between different information and concepts.
