Renal Imaging
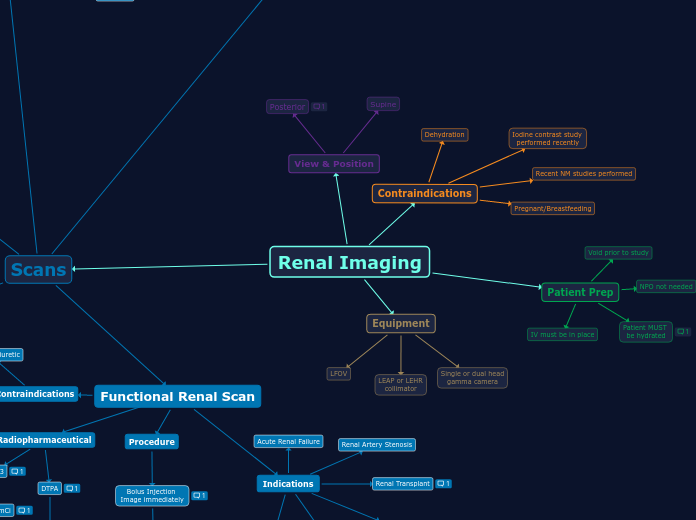
View & Position
Supine
Posterior
Unless the study is post transplant, then an anterior view is acquired.
Scans
Cystogram
Used to visualize the bladder
F.O.V.
- Have bladder and bag in F.O.V.
- Dome of bladder in bottom of F.O.V.
- Kidneys in the upper F.O.V. (not necessary to have full kidneys in view
45 min study
3 phases:
- Bladder full
- Urination phase (Micturition)
- After voiding
Preparation
- Need to have a foley catheter
- Cover all surfaces with chucks
- Prep saline bag (250-500 mL) Inject radiopharmaceutical into bag
Flow
Filling Phase: 10 sec/frame- 60 seconds
Start imaging
- Filling phased: start image for flow
- Fill bladder completely with saline/radiopharm mix through foley port (calculated by-- Age of patient x 30 =
bladder capacity)
- Fill bladder till drip slows or leakage of port
Watching for reflux above the bladder.
If there is reflux:
- Record saline infused at that time.
Pre-Void Phase
Pre-Void Phase: 120 second static image
Full Bladder:
- Stop flow images and immediately start static image of Posterior of patient.
- (If possible) Right & left obliques
- Record the amount of saline used to fill and CPM
Have patient hold bladder!
Void Phase
Voiding phase: 2 sec/frame 120 sec
Start 2nd "flow" study:
- Deflate foley Cath.
- sit patient up and use potty chair
- Have patient urinate
- Visualize urination
Post-Void Phase
Post Void Phase: 120 sec static image
- Record Cpm
- Measure and record volume in mL of voided fluid
- Calculate Saline- volume urinated
- Review for signs of reflux
- Activity in upper urinary tracks seen during filling, pre ,and during voiding
- No visualization of reflux of tracer past bladder during filling or voiding.
- All or most solution is voided from bladder
1 mCI
TC99m DTPA
Tc99m- Diethylenetriamine Penaacetic Acid
Tc99m Sulfur Colloid
Significant renal dysfunction
Evaluate and detect VUR
Vesicoureteral Reflux- failure of the Uretervesical valve.
Morphological Scan
Renal Cortical Scintigraphy
Peds Dose: 50 uCi/kg
Tc99m GH
Tc99m- Glucoheptonate
15-20 mCi
Tc99m DMSA
- Tc99m Dimercaptosuccinic acid
- Preferred radiopharmaceutical due to 40% retained in tubules.
5 mCi
Inject radiopharmaceutical
via IV
Wait 2 hours to image
Images
- SPECT 180
- Planar 500k counts, ANT/ POST
- (optional) Pinhole(look at each kidney individually
- Decreased uptake: possible mass
- Decreased uptake in renal paranchyma - Pyelonephritis
- Uptake will be seen in the Column of Bertin.
- homogenous uptake
Contraindications: None
presence or absence of renal infarctions
Differentiate between mass and normal variant
Normal variant is the Column of Bertin
Detect Pyelonephritis
Pyelonephritis:Kidney infection that starts in the bladder and travels to kidneys. This is due to reflux of bacterial infected urine.
Renal Scan With ACE Inhibitor
Renal Scintigraphy Augmented by ACE inhibitor
ACE inhibitor Administration
- Captopril - 50mg pill (Oral) - 1 hour prior to radiopharmaceutical
- Enalaprilat - 40ug/kg (IV) over 3-5 min. - 10 min prior to radiopharmaceutical
Injection of RadiopharmaceuticalImage Immediately
IV Bolus
Functional renal scan procedure
Renogram
This establishes a Time-activity curve, representing perfusion and function of the kidneys.
If test proves abnormal- acquire baseline test (with no ACE inhibitor) 3-4 days post.
Normal results: No significant abnormalities in the time-activity curve
Non-Radiophamecutical
Enalaprilat
40ug/kg
IV administration given over 3-5 minutes
monitor blood pressure prior and after administration
Captopril
25-50 mg
monitor blood pressure every 15 minutes for 1 hour post administration
Patient currently on ACE inhibitor
Patient needs to discontinue ACE inhibitor
- Captopril- 48 hours prior to scan
- Lisinophil or Enalaprilat- 1 week prior to scan
RAS wit Hypertension
Renal Hypertension & no RAS
RAS: Renal Artery Stenosis
Diuretic Renal Scan
Non-Radiopharmaceutical
Furosemide
Doses:
- Adult: 40 mg
- Peds: 1mg/kg max 40 mg
Bolus Injection Image Immediately
ROI:
- Sternal notch in top 1/3
- kidneys center of view.
- Bladder at bottom 1/3
Dynamic acquisition "Function"
- Represents the function of the kidneys.
- Dynamic acquisition for 20-30 min. 20sec/frame.
- Can be used to determine both absolute and relative renal function.
Inject Furosemide
- Inject Furosemide (Lasix) at the 20-30 minute mark. This is very important as timing is crucial to this study
- Dose: Adult- 40 mg Peds- 1mg/kg max 40 mg
- Inject Furosemide over 2-3 minutes
- Have patient hold bladder
Lasix response- 2-5 min
max- 15 min.
Dynamic acquisition #2
Continue Dynamic acquisition for another 20-30 min.
20 sec/frame
(Optiona) Post void
Renogram
Abnormal
Normal
Functional Rph:
Tc99m- Diethylenetriamine Penaacetic Acid
MAGS3
GOLD STANDARD
Functionl Rph:
Tc99m- Mercaptoacetylglycylglycylglycine
10 mCi
UTI
Function
- Evaluate function & post-diuresis drainage
Functional Renal Scan
Patient on diuretic
Patient on ACE inhibitor
Indications
Renal Artery Stenosis
Hydronephrosis
Occurs in infants
Renal Function
Renal function and Urodynamics
Split renal function
Renal perfusion
Urinary Reflux & Scarring
Acute Renal Failure
Renal Transplant
Post transplant evaluation of function
Procedure
Bolus Injection Image immediately
ROI:
- Sternal notch in top 1/3
- kidneys center of view.
- Bladder at bottom 1/3
Blood flow & filtration
Dynamic acquisition. 20 frames at 3sec/frame- 1 min.
Represents the the initial arrival of Rph into the kidneys.
Lasts 30-60 seconds.
Dynamic Aquistion "Function"
- Represents the function of the kidneys.
- Dynamic acquisition for 19-30 min. 20sec/frame.
- Can be used to determine both absolute and relative renal function.
(Optional)Post Void
Static acquisition for 2 min. after patient has voided.
Position: Supine or sitting
Processing
Renogram
This establishes a Time-activity curve, representing perfusion and function of the kidneys.
The curve:
1) Vascular Transit Phase: perfusion of kidneys and aorta.
2) Tubular Concentration Phase: the peak of the curve. correlates with ERPF.
3) Excretion Phase: Down slope of the curve, produced by excretion of Rph and clearance of collecting system.
Abnormal Study
Any deviation from the "normal" activity curve.
Less than 600mL/min
Normal Study
Assessing ERPF- Normal is 600mL/min
Max activity: 3-5 min
Renal uptake ratios: 2-3 min
1/2 Time excretion: 8-12 min
Radiopharmaceutical
DTPA
Functional Rph:
Tc99m- Diethylenetriamine Penaacetic Acid
- Glomerular filtration agent
- No tubular excretion
Dose:10-20mCi
Pediatric Dose: 200 uCi/kg; Min. 2 mCi
MAG3
GOLD STANDARD
Functionl Rph:
Tc99m- Mercaptoacetylglycylglycylglycine
- Tubular secretion
- Effective renal plasma flow agent
Dose: 10-20mCi
Pediatric Dose: 100 uCi/kg; Min. 1mCi
Patient Prep
Void prior to study
NPO not needed
Light meal and hydration before scan are okay.
Patient MUST be hydrated
This can be done by drinking fluids- at least 20 ounces, or can be done by IV hydration- 250mL
IV must be in place
Equipment
Single or dual head gamma camera
LEAP or LEHR collimator
LFOV
Contraindications
Dehydration
Recent NM studies performed
Pregnant/Breastfeeding
Iodine contrast study performed recently


