The data entry pages cannot be easily manipulated
It is complicated when using it for the first time.
The files take up a lot of space, although simple calculations are performed.
The bad It is only compatible with Windows and Macintosh.
The worst thing is that only one person at a time can use it.
CONTRAS
The least is Python does not have protected identifiers
The worst thing is that many servers do not support Python
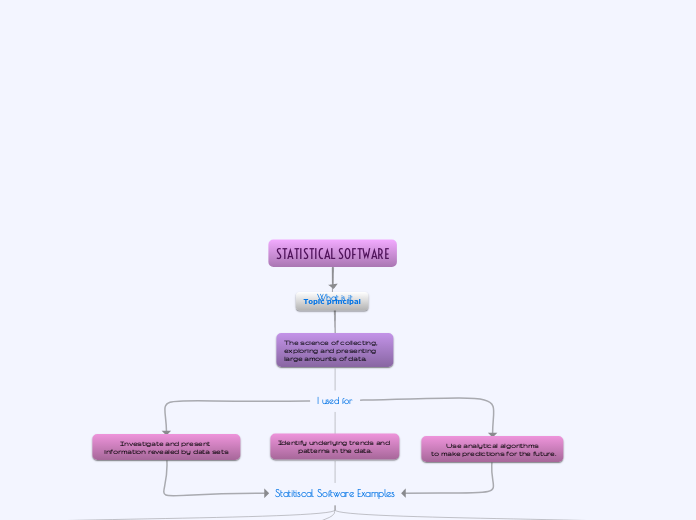
Investigate and present information revealed by data sets
Use analytical algorithms
to make predictions for the future.
What is it
The science of collecting, exploring and presenting large amounts of data.
I used for
Identify underlying trends and
patterns in the data.
Statitiscal Software Examples
MINITAB
It helps companies and institutions spot trends, solve problems, and uncover valuable insights in data by offering the best comprehensive set of machine learning, statistical analysis, and process improvement tools.
Visualizations
It is the best since in a single page you can have all the graphs and data.
It is the most widely used for quality improvement and teaching statistics.
The report sheet explains all the data necessary to prepare an analysis.
Descriptive and inferential statistics
It is the best alternative for statistical analysis.
identify distributions, correlations, outliers and missing values.
Predictive Analytics
With tools for logistic regression, time series analysis, factor analysis and cluster variables, users can take a peek into future possibilities.
EXCEL
It is a very important tool especially for companies, since in this program they can carry out their accounting, their invoices, data analysis, customer / supplier agendas, all kinds of databases, etc.
Templates
They are the most for making invoices, for managing the company's stock, for controlling suppliers, etc.
Graphs
They can be analyzed very quickly and understood more easily, an example could be graphing the weekly, monthly or annual sales of a certain product.
Financial tools
They are the best for calculating interest rates, monthly loan payments, among others.
Tables
It is very easy to order the data, we could do it for the registration of our clients, products, sales, etc.
PYTHON
Inside a company
Developers use Python to crawl a database. More and more control of ILM programs, created a simpler unified set of tools that enabled more effective production pipeline.
PROS
Simplified and fast
Very simplest to interpreter
This saves a lot of time for scheduling and creating projects
Neat and clean
It is a very friendliest to understand for any programmer
Multi Platform
It is used in the design of web applications or artificial intelligence, among many others.
The very easy to use on various operating systems
Open Source
It is totally free.
very good for creating extensions or developing modules.
STATISTICAL SOFTWARE
Topic principal


