av Desi McKeown 3 år siden
865
Computing

av Desi McKeown 3 år siden
865

Mer som dette
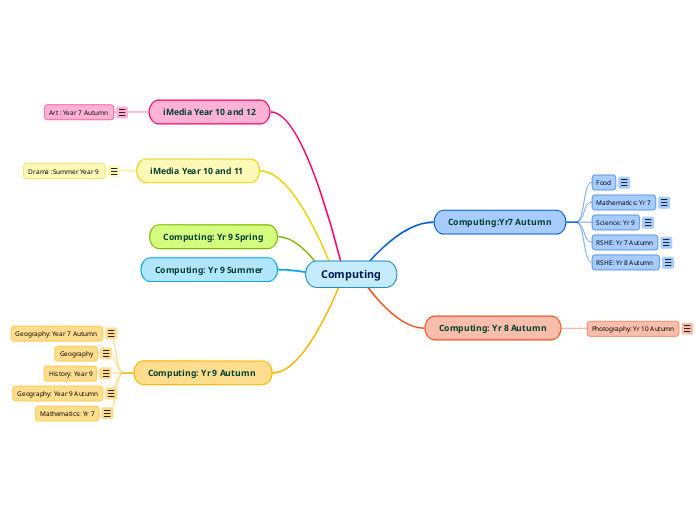
Pupils look at data sets and produce charts based on the results. Pupils analyse these charts and compare them to pre concieved ideas.
Pupils look at cause and effect within data and pupils can see the imact of war within the data sets.
Pupils look at global data including population growth.
Pupils look at data both local and global and analyse the results.
Pupils in iMedia will need to look at planning media and this includes film and television pre production including scripts.
Pupils will look at colour theory in IMedia and meanings of colour.
Links with Logic gates and Logic circuits
Pupils will be looking at the risks of being online and talking to people they have not met via chatrooms and social media and cyber bullying. Links with risk taking behaviour.
Pupils will be looking at the risks of being online and talking to people they have not met via chatrooms and social media and cyber bullying.
Pupils look at data sets and produce a series of suitable charts.
Pupils will look at a recipe and use spreadhseet tools to calcuate the volumes of ingredients depenting of the numbers of people eating.