The experiment investigates the activity of amylase, an enzyme that catalyzes the breakdown of starch into sugars. The study involves creating a maltose standard curve, setting up control and experimental tubes, and measuring absorbance to calculate maltose concentration and amylase activity.
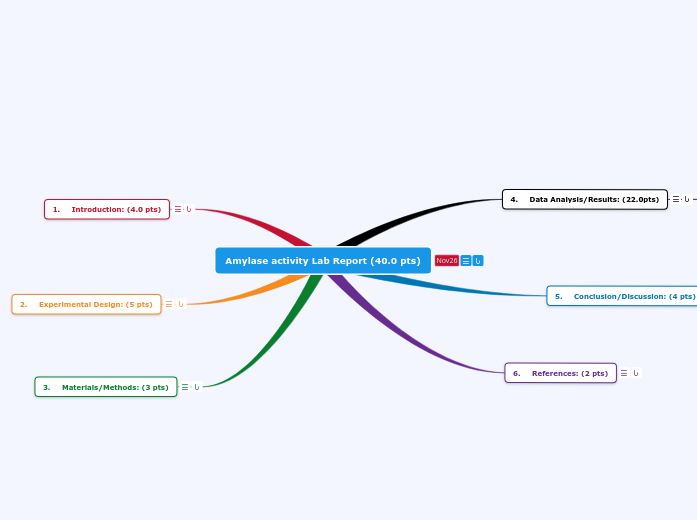
d. Summary of results: summarize your results based on your graphs (3 pts)
c. Prepare the following graphs:
• Graph 2 of enzyme activity versus independent variable (4 pts)
• Graph 1 of maltose standard curve: show line of best fit and equation of line if done on excel. If done manually, insert an image of your graph indicating the line of best fit. (3 pts)
b. Prepare the following tables:
• Table 3 with absorbance measurements of experimental tubes, calculated maltose concentration, calculated amylase activity (mg/ml maltose/min) (4 pts)
• Table 2 with your experimental setup. Explain how your control tubes will be set up.
(2 pts)
• Table 1 with maltose standard curve data. (3 pts)
a. List all the formulas you used for your calculations and a sample calculation in each case
(3 pts)