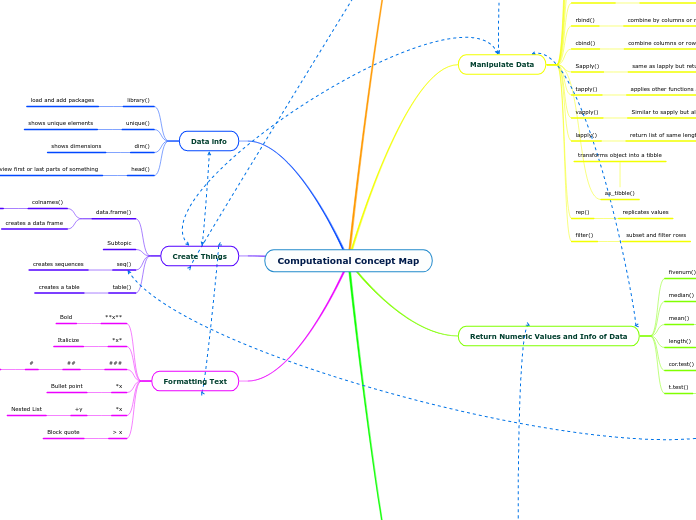
Computational Concept Map
Formatting Text
> x
Block quote
+y
Nested List
*x
Bullet point
###
##
#
Title sizes
*x*
Italicize
**x**
Bold
Create Things
table()
creates a table
seq()
creates sequences
Subtopic
data.frame()
creates a data frame
colnames()
set row or column names
Data info
head()
view first or last parts of something
dim()
shows dimensions
unique()
shows unique elements
library()
load and add packages
Operators and Some Arithmetic Functions
Miscellaneous
%*%
Multiply matrix with transpose
:
Series of numbers
%in%
Shows if element is in a vector
Assignment
Assign Values
Right Assignment
->>
->
Left Assignment
=
<<−
<−
Logical
||
&&
Says true if both elements are true
|
Gives true if one element is true
!
Opposite logical value
&
Says true if elements are both true
Relational
!=
Shows if something is unequal
>=
Shows greater than or equal
<=
Shows less than or equal
==
Shows if elements are equal
<
Shows less than
>
Shows greater than
Arithmetic
/
divide
+
adds
-
subtract
*
multiply
^
Rasie to an exponent
%%
Remainder
%/%
Divide first vector from second quotient
sqrt()
sqaure root function
abs()
absolute value function
sample()
generate random number
Return Numeric Values and Info of Data
t.test()
one and two sample t-tests
cor.test()
tests for corellation
length()
shows length of vectors
mean()
gives mean
median()
sample median
fivenum()
returns minimum, lower-hinge, median, upper-hinge, maximum
Manipulate Data
filter()
subset and filter rows
rep()
replicates values
as_tibble()
transforms object into a tibble
lapply()
return list of same length as original input
vapply()
Similar to sapply but allows argument for specific returns
tapply()
applies other functions across groups
Sapply()
same as lapply but returns a vector or matrix
cbind()
combine columns or rows
rbind()
combine by columns or rows
summarize()
see a summary of data in a specific column
mutate()
create new columns and add them
pivot_longer()
increase rows and decrease columns
arrange()
reorder or order rows by a specific column
select()
select columns and specify order and what's included
group_by()
turns existing table into a grouped table
Plotting and Visualizing
heatmap()
creates a heatmap
ggtitle()
adds a title to a plot
labs()
creates plot labels
geom_smooth()
helps see patterns
geom_boxplot
create boxplots
geom_point()
used to create scatterplots
aes()
adds aesthetic to plot
abline()
adds a line to a plot
barplot()
creates barplots
ggplot()
create plot and add layers
qplot()
quick plotting
plot()
generic plotting

