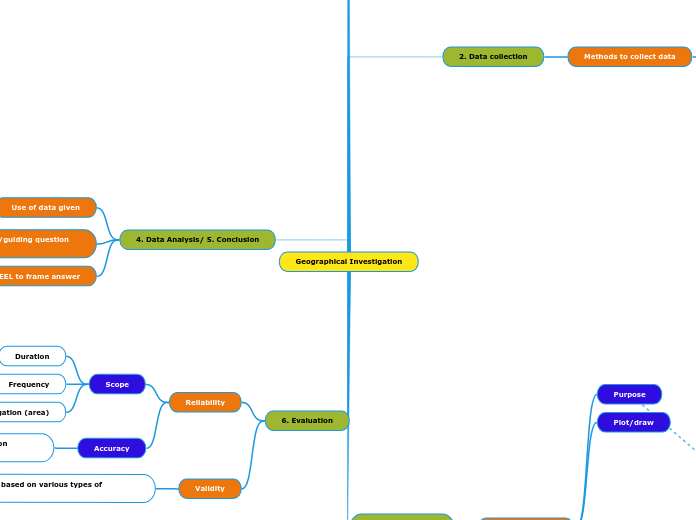
Geographical Investigation
6. Evaluation
Validity
Judgment based on various types of evidence
Need to support with data
Validity of hypothesis
Reliability
Accuracy
Usage of instruments/ data collection methods
Scope
Extent of investigation (area)
Frequency
Duration
4. Data Analysis/ 5. Conclusion
Use PEEL to frame answer
Refer back to hypothesis/guiding question to help craft your point
Use of data given
Need to process data i.e. convert to percentage/find difference etc.
3. Data Representation
Types of graphs
Describe/outline steps
Points
Legend
X-axis, y-axis
Type
Wind rose
wind speed and direction
Scatter graph
Relationship
Pie chart
Proportion
Bar graph (simple/comparative)
Categorical data; comparison
Line graph (simple/comparative)
Trends over time; comparison
Plot/draw
Purpose
2. Data collection
Methods to collect data
Considerations to be made
Recording sheet
Table
Headings
Site
Weather conditions
Time
Date
Sampling methods
Purpose, advantages, disadvantages
Convenience
Stratified
Systematic
Random
Sample size
At least 100 respondents
Accuracy; minimizing errors and bias; knowing the purpose of using such methods
Tourism
Bipolar survey
Survey questionnaires/interviews
Land use survey
Tourist/pedestrian/traffic count
Weather and climate
Relative Humidity
Sling psychrometer
Wind direction
Wind vane
Wind speed
Anemometer
Air pressure
Barometer
Rainfall
Rain gauge
Temperature
Stevenson screen (only if applicable)
Sixth's thermometer
1. Crafting hypothesis/guiding questions
Guiding Questions
How/why
Question form
Hypothesis
Testable
Independent, dependent variables
Statement
