Категории: Все - correlación - causas - datos - problemas

по Victoria Liliana Ortiz Anaya 2 лет назад

264

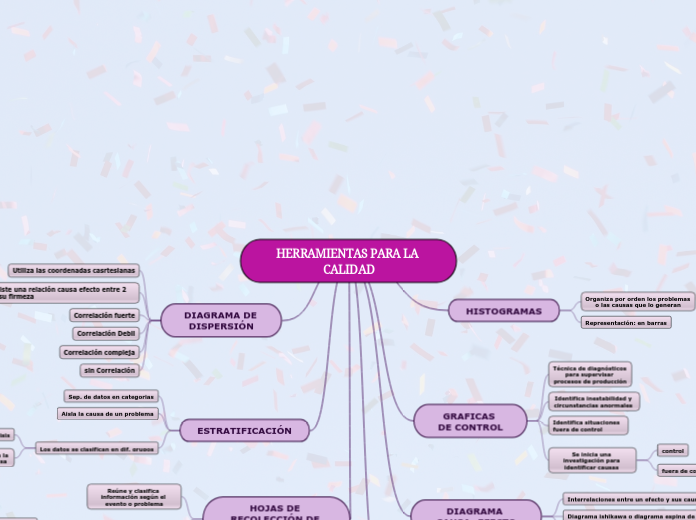
HERRAMIENTAS PARA LA CALIDAD

Las herramientas de calidad son fundamentales para supervisar y mejorar procesos de producción. Las gráficas de control ayudan a identificar situaciones fuera de control, lo que permite iniciar investigaciones para determinar las causas subyacentes y corregirlas.
HERRAMIENTAS PARA LA CALIDAD

HERRAMIENTAS PARA LA CALIDAD

Enter your names.
Example: Jane's and Arthur's wedding

HOJAS DE RECOLECCIÓN DE DATOS

Instrumentos para recolectar datos:
cualitativas
Cuantitativos
Reúne y clasifica información según el evento o problema

ESTRATIFICACIÓN

Los datos se clasifican en dif. grupos
Etapa en la que se usa
Analisis
Aisla la causa de un problema
Sep. de datos en categorias

DIAGRAMA DE DISPERSIÓN

Many couples choose digital correspondence for environmental purposes or cost savings. You can choose 3D designs, animations or short movies for the invitations. Guests will always have their cell phones on them and this makes communication less time-consuming.

sin Correlación
Correlación compleja
Correlación Debil
Correlación fuerte

However, if you choose traditional paper invitations, have them made in the theme of the wedding. Also, don't forget to send envelopes with postage for the RSVP cards.

Define si existe una relación causa efecto entre 2 variables y su firmeza
Utiliza las coordenadas casrtesianas

For a destination wedding, it's best to send the save the dates 8 to 12 months in advance. For a local affair, send save the dates 4 months in advance.

Follow your save the dates with formal invitations about 8 weeks before the wedding.

DIAGRAMA DE PARETO

solucion de un problema de forma sistematica
Separa gráficamente los aspectos de un problema

DIAGRAMA CAUSA- EFECTO

Choose a cake that matches the style of the venue, the season, your gown, the flower arrangements or the menu. If you want colorful accents such as sugar flowers or icing ribbons, give swatches to your baker.

Identifocar las causas de un problema
Diagrama ishikawa o diagrama espina de pescado
Interrelaciones entre un efecto y sus causas

GRAFICAS DE CONTROL

Se inicia una investigación para identificar causas
fuera de control
control
Identifica situaciones fuera de control
Identifica inestabilidad y circunstancias anormales
Técnica de diagnósticos para supervisar procesos de producción

HISTOGRAMAS

Representación: en barras
Organiza por orden los problemas o las causas que lo generan