Produkter
Desktop-mjukvara
Skapa översikt
Programvara för Gantt-diagram
Användningar
Tankekartor för utbildning
Mind map för företag
Mindskartor för personlig utveckling
Fördelar med Mind Mapping
Resurser
Funktioner
Utbildning
Personligt & Arbete
Desktop
Video Tutorials
Watch tips and tricks about using Mindomo.
Help Center
Detailed help guide on configuring and using Mindomo.
Artiklar
Top 29 Mind Map Examples
Gantt Chart Software
Concept Map Template
Free mind map software
What is a concept map?
Gantt Chart Maker
Mind Map App
Concept Map Maker
Mind map template
Prissättning
Logga in
Registrera
Produkter
Desktop-mjukvara
Skapa översikt
Programvara för Gantt-diagram
Användningar
Tankekartor för utbildning
Mind map för företag
Mindskartor för personlig utveckling
Fördelar med Mind Mapping
Resurser
Blogg
Video Tutorials
Help Center
Vad är tankekartor?
Skapa en tankekarta online
Koncept Map Maker
Artiklar
Top 29 Mind Map Examples
Gantt Chart Software
Concept Map Template
Free mind map software
What is a concept map?
Gantt Chart Maker
Mind Map App
Concept Map Maker
Mind map template
Funktioner
Utbildning
Personligt & Arbete
Desktop
Prissättning
Registrera
Logga in
Kategorier:
Alla
-
hypothesis
-
statistics
av
jason kyle
för 16 årar sedan
338
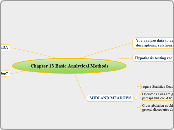
Chapter 13 Basic Analytical Methods
This section delves into fundamental analytical techniques used to determine relationships within data. It highlights key methods such as Spearman and Pearson's correlation coefficients to assess the strength and direction of relationships.
Öppna
Mer av detta
Inferential Statistics Mind Map
av Bryan Cisneros
Scientific Thinking
av omar nafie
Language Acquisition
av Katelin Eagen
Inferential Statistics Mind Map
av Bryan Cisneros
Chapter 13 Basic Analytical Methods
MIDLAND MEADOWS
Crosstabulation could be useful and simple enough to formgeneral discoveries about golfers at MM
Operator's skills are geared towards opearting a golf courseperhaps this could be outsourced
require Statistics Coach!
IS there a relationship?
pearson's r
helps determine strength and direction of relationship
spearman
contigency correlation
adds to crosstabulation by judginf strength of relationship
Crosstabulation
use of percentages and comparisonsto make assumptions
EDA
Summarizes data susing visula charts
Explore data in the simplist way possible
Hypothesis testing requires statistical inferencing
Determination of relationships and differences
9 step process
You analyze data to uncover usefuldescriptions. relationships, and differences
Subtopic
Various degrees of generalization and testing