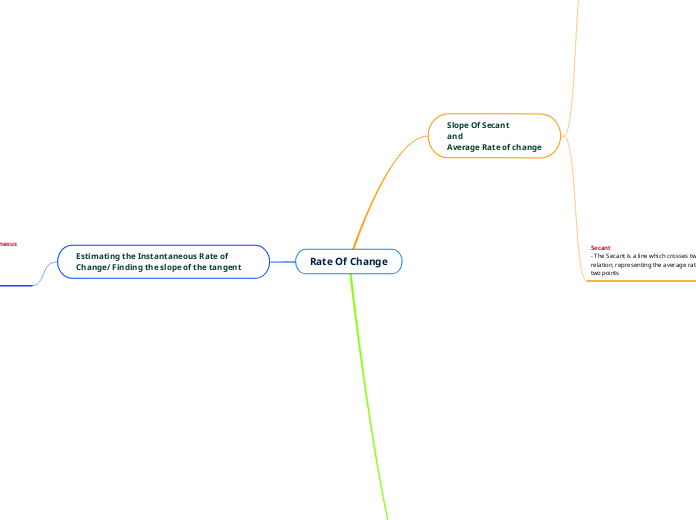
Rate Of Change
Estimating the Instantaneous Rate of Change/ Finding the slope of the tangent
The three methods used to estimate the instantaneous rate of change/ the slope of the tangent are:
1) Preceding/ Following Interval
2) Centred Interval
3) The "Difference Quotient"
The Difference Quotient
- With this method you use the Difference quotient formula (this is the same formula as the third formula for the slope of the secant)
- In the formula you plug the following interval for f(x + h) the x value from the point of tangency for f(x). the difference between the two value is shown through the value of h
Example
If the point is x = 3
f(x + h): 3.001
f(xx): 3
h: 0.001
1) Plug each part into the formula and the answer is the IRC
Step by step Tutorial on how to use this method
Centered Interval
- This method is similar to the first one.
- Instead it finds the the slope between the preceding interval and the following interval
Example
if the point is xx = 6
Points: 5.9 < xx < 6.1
1) Find the slope between 5.9 and 6.1.
2) Plug the intervals into the equation and see if the sum progresses at the same rate of the IRC.
Step by Step tutorial on how to use this method
Preceding/ following Interval
- This method requires you find the the slope that proceeds the point of tangency, then find the slope that follows that same point. And then find the average between the two
Example
- if the point is x = 4
Preceding interval: 3.9 < x < 4
Following interval: 4 < x < 4.1
1) Find the slope between 3.9 and 4, then find the slope between 4 and 4.1
2) Add the two sums together and divide by two
Note: Its mandatory to keep these intervals relatively small
Step By Step tutorial on to use this method
Tangent Line
and
Instantaneous Rate Of Change
The Tangent Line
- the tangent line touches a relation at one point on a curve. This point is labeled as P. Also known as "the point of tangency.
- The line follows the same direction of the relation.
The pink line illustrates how the tangent line might looks
The Instantaneous rate of change
- It's the exact rate of change at a given dependent variable.
- In order to find the slope of the tangent you use the instantaneous rate of change formulas.
In this image, the Point of tangency is at (1,3). When finding the Slope of the Tangent you just use (1)
A question relating to this image could be: What is the instantaneous rate of change at x = 1
Slope Of Secant
and
Average Rate of change
Secant
- The Secant is a line which crosses two points of a graphed relation, representing the average rate of change between the two points
Slope of the secant
- in order to find the slope of any secant, you have to use the equation for the average rate of change.
These are various formulas used to find the slope of the secant
- Ultimately they are asking the same thing, ( which is shown in the first formula)
- The second formula is the exact same as the first one, it's just shown in a different form
- The third formula use the letter 'h' which represents the difference between y2 and y1. So the top part is y2 - y1, and its divided by the difference between the two
Example: If the secant line was the line that intersected (1, 2) and (4, -1) then the slope of secant would be -1. The slope was found through the use of the average rate of change formula.
In this image, you can see that the secant line intersects two parts of the curve.
The Average Rate Of Change:
- The average rate of change determines the difference per unit within a given interval
- Technically it looks at the change of the range over the change in the domain.
- With this information we can estimate how much a relation progresses at a constant pace.
- in most cases the average rate of change doesn't accurately depict how the relation is actually increasing or decreasing.
Average Rate Of Change Equations
- these are the various equations you can use to see the average rate of change
An example of how to use the average rate of change equation when looking at a table
an example of how to to use the average rate of change equation when looking at a graph.


