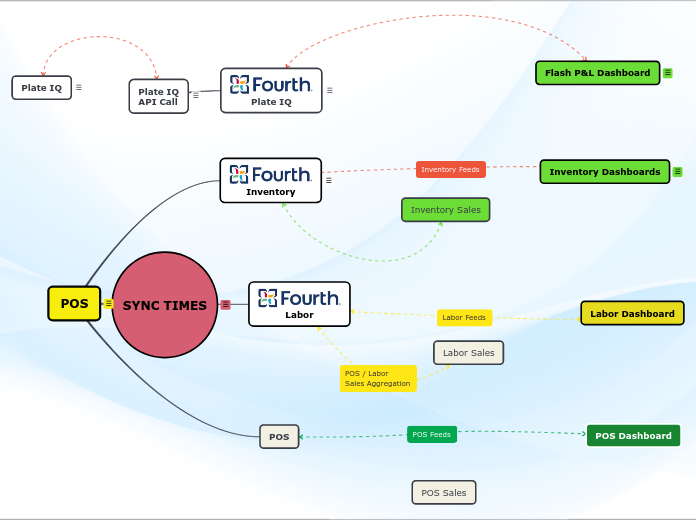
SYNC TIMES
Core Application Sync Times
POS 9:30am est / 4:30 pdt
Labor 9:30am est / 4:30 pdt
Labor 11:30 am est / 6:30am pdt
Inventory 1:00pm est / 8am pdt
Adjust sync times to 9am est
Flash P&L Dashboard
Flash P&L Dashboard
- Updates Daily via API
- Drill Down enabled from High level KPI to GL Transaction by location & date.
- Inventory figures will only present the day after inventory period has been posted and closed.
Plate IQ
Shari's AP Platform
- Flash P&L
- Gross Profit
- Contribution Margin
- GL Exports
- Enterprise Reporting
Plate IQ
API Call
Fourth API Call
Shari's to provide Fourth with API credentials to Plate IQ
Daily export
Import received and sent to both storage and Shari's KBC Environment for further transformation.
Plate IQ Integration transforms data to the table format needed to be consumed into Analytics.
Shari's KBC environment exports transformed tables to Analytics Flash P&L Dashboard.
- GL codes mapped 1 to 1
- All changes made in core app will be reflected on following sync
Plate IQ
Plate IQ integration
- Receive import from Plate IQ
- Compare to Units table within Analytics
- Concatenate GUID w/GL codes
- Remap Data by GUID
- Export to Analytics Flash P&L
POS Sales
Labor Sales
Inventory Sales
Labor Dashboard
Inventory Dashboards
Inventory Dashboard Sales Variance
During initial config, sales filters are applied with customer direction to align the core application with desired result in Analytics. Ex. comps, discounts, etc.
Adjust Net Sales Metric within Analytics to more closely align with POS/Labor.
Analytics Inventory feeds have been configured to aggregate Net Sales before posting.
- Remove all filters from core application feed
- Re-map necessary sales filters with Customers guidance
(Analytics Team) address the sales variance by remapping inventory net sales within Analytics to match Inventory.
(Inventory team) will be responsible for making the necessary adjustments to align with POS Sales.
POS Dashboard
POS
Labor Sales:
Customer has accepted the variances within the core application (Labor) and does not hinder performance of Labor Analytics Dashboards.
POS Sales:
Customer has confidence in these numbers and are quite satisfied with the result from POS
Inventory Sales:
- Providing an additional work-around will further perpetuate the issues and introduce more risk.
- Customer expressed that re-config of every item and modifier not feasible.
Current work-around:
- Food Recipe Filler - negative sales / item modifier
This workaround has caused the unfortunate byproduct of negative value, skewing core application sales/costs.
Downstream this is effecting Inventory Analytics Dashboards
- POS Sales are correct within Analytics
- Inventory Sales are not correct within Analytics
- Labor Sales have expected variances within Analytics
By addressing the configuration within core applications you will resolve the variance within sales $
Using another sales feed is not advised.
Labor
Inventory
Follow-up w/RME
With regards to item visibility between brands


