类别 全部 - vectors - graphs - functions - trigonometry

作者:Melia Fortin 1 年以前

92

Unit 1 - Preparing for physics RT

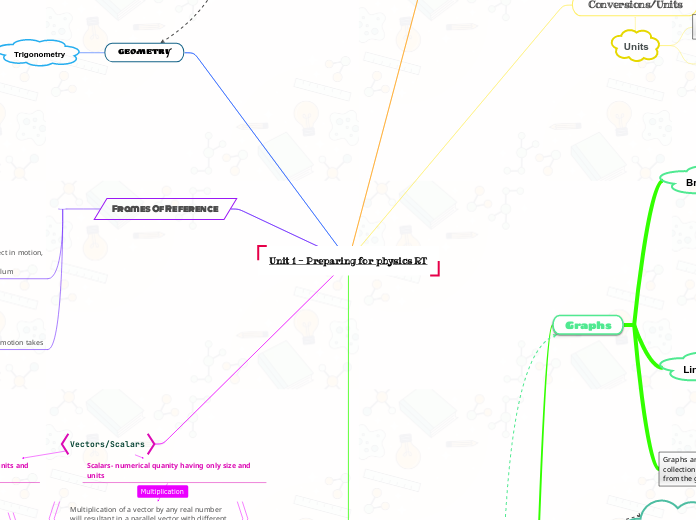
The material covers foundational concepts in physics, focusing on the mathematical tools and principles needed to analyze physical phenomena. It begins with Geometry and Trigonometry, essential for understanding shapes, angles, and the relationships between different sides of triangles.
Unit 1 - Preparing for physics RT

Unit 1 - Preparing for physics RT

Vectors/Scalars

Scalars- numerical quanity having only size and units
Multiplication of a vector by any real number will resultant in a parallel vector with different lengths.

direction stays the same

direction is exactly the opposite

Vectors- numerical quanity having size,units and direction
Tip to tail method- connecting vectors and drawing R

1. create table to add together the Xs and Ys 2. use Pythagorean to find magnitude 3. use Tan-1 to find direction

direction= θ = tan-1 (y/x)

magnitude= v|=√a2+b2

1. use Sin and Cos to find components 2. given components steps

X value= Ax=A cos θ

Y value= Ay=A sin θ

Put vector tails together and complete the triangle, pointing the vector that comes first in the subtraction.

Frames Of Reference

Geometry

Suggest
[[Suggestion
[[TopicTextSuggested text1Suggested text2

]]

ed text1|
Suggested text2]]

Trigonometry
Tan= opp/adj
Sin= opp/hyp
Cos= adj/hyp
Pythagorean Theorem= c2= a2+b2

Properties of a function

Minimum
Maximum
(Y-axis)
Variation
Increasing, decreasing or constant.
sign
Above or below the x axis/ y axis
Y-Intercept
(Initial values)
X-Intercept
(Zero's)
Rangeeeee (theres many e's because it keeps translating in french)
(Y-Axis)
Domains
(X-Axis)
Graphs
Graphs are known to be a science based on a collection of data, making it easier to analyze data from the graph.
Line of best fits

Line of best fits is a type of data that is meant to be alligned to a higher degree of correlation. It can either be a curved line or a straight line depending on it's situation.

Broken line Graph

A broken line graph represents a data that progresses unevenly through an event.

Conversions/Units

Units
SI Units: System of Unit of measure

Length(m),Mass(kg),Time(s)

Used to compare two or more quantities
Metric System
King Henry Died Unexpectedly Drinking Chocolate Milk ( used to remember the order)

Goes up by 10s(10^2, 10^3)

Angles

Geometry of angles
Quadrilateral add up to 360
Triangles add up to 180
vertically opposite angles
Corresponding angles
Alternate exterior angles
Alternate interior angles