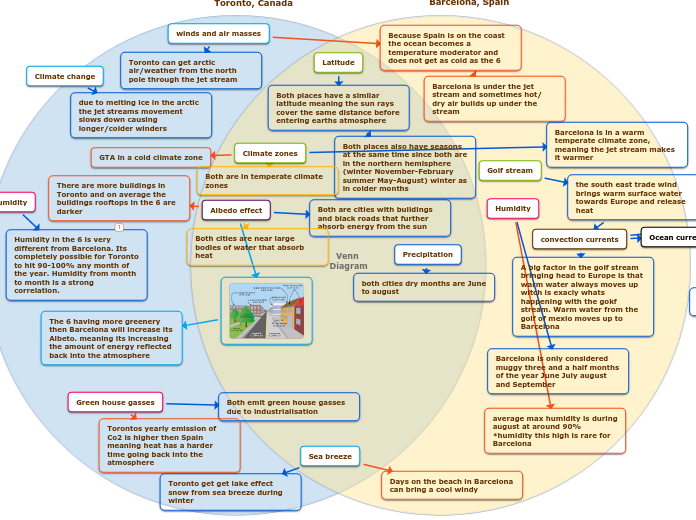
Precipitation
both cities dry months are June to august
Humidity in the 6 is very different from Barcelona. Its completely possible for Toronto to hit 90-100% any month of the year. Humidity from month to month is a strong correlation.
Golf stream
the south east trade wind brings warm surface water towards Europe and release heat
convection currents
A big factor in the golf stream bringing head to Europe is that warm water always moves up witch is exacly whats happening with the gokf stream. Warm water from the golf of mexio moves up to Barcelona
Ocean currents
Climate change
due to melting ice in the arctic the jet streams movement slows down causing longer/colder winders
Climate zones
Both are in temperate climate zones
GTA in a cold climate zone
Barcelona is in a warm temperate climate zone, meaning the jet stream makes it warmer
Sea breeze
Days on the beach in Barcelona can bring a cool windy
Toronto get get lake effect snow from sea breeze during winter
Albedo effect
Both cities are near large bodies of water that absorb heat
There are more buildings in Toronto and on average the buildings rooftops in the 6 are darker
Both are cities with buildings and black roads that further absorb energy from the sun
Green house gasses
Torontos yearly emission of Co2 is higher then Spain meaning heat has a harder time going back into the atmosphere
Both emit green house gasses due to industrialisation
winds and air masses
Because Spain is on the coast the ocean becomes a temperature moderator and does not get as cold as the 6
Barcelona is under the jet stream and sometimes hot/ dry air builds up under the stream
Toronto can get arctic air/weather from the north pole through the jet stream
Humidity
average max humidity is during august at around 90% *humidity this high is rare for Barcelona
Barcelona is only considered muggy three and a half months of the year June July august and September
Latitude
Both places have a similar latitude meaning the sun rays cover the same distance before entering earths atmosphere
Both places also have seasons at the same time since both are in the northern hemisphere (winter November-February summer May-August) winter as in colder months
Barcelona, Spain
Type in the name of the second group and press Enter.
Double-click in the background to add items to this group, or drag to position them in the overlap between the two groups.
Toronto, Canada
Type in the name of the first group and press Enter.
Double-click in the background to add items to this group, or drag to position them in the overlap between the two groups.
Venn Diagram
A Venn Diagram compares items by assigning them to groups. An item can belong to:
- Neither group, if it is placed outside the circles
- One group only, if placed in one of the crescents
- Both groups, if placed in the overlap area.
The item counts (and not the areas of the circles and their overlap) indicate the population of each group or the overlap between groups.