Prediction and Forecasting
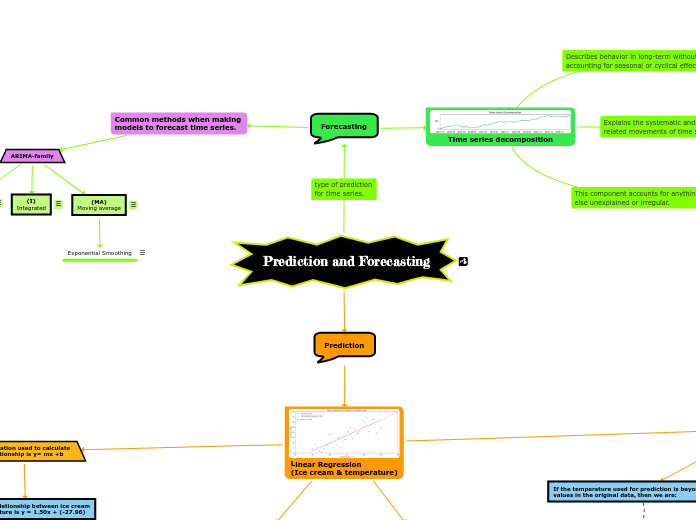
Forecasting
Common methods when making
models to forecast time series.
ARIMA-family
(MA)
Moving average
The moving average component uses a sliding window to average the last x observations where x is the length of the sliding window.
Exponential Smoothing
The moving average puts equal weight on each time period in the past involved in the calculation. In practice, this isn't always a realistic expectation of our data. Sometimes all past values are important, but they vary in their influence on future data points. For these cases, we can use exponential smoothing, which allows us to put more weight on more recent values and less weight on values further away from what we are predicting.
(I)
Integrated
The integrated component concerns the differenced data or the change in the data from one time to another.
(AR)
autoregressive
Autoregressive models take advantage of the fact that an observation at time $t$ is correlated to a previous observation, for example at time t-1.
Note that not all time series are autoregressive.
Time series decomposition
cyclical component
Hurricane driving the number of ice cream trucks down in the short-term because it isn't safe to be outside.
seasonality component
The number of ice cream trucks
is higher in the summer months.
Trend component
The population of Earth is increasing,
or the value of a stock is stagnating.
Prediction
Linear Regression
(Ice cream & temperature)
Predictions
If the temperature used for prediction is beyond the values in the original data, then we are:
Making predictions from the dotted portion of the line.
Trends don't continue indefinitely. If it is too hot people might not leave their A.C. cooled home, resulting in no sales.
Temperature value used for prediction is within the range of original data points used to build regression
Making predictions from the solid portion of the line
The equation used to calculate
the relationship is y= mx +b
The linear relationship between ice cream
and temperature is y = 1.50x + (-27.96)
ice cream sales = 1.50 x (temperature = x) -27.96
ice cream sales = 1.50 x (35) - 27.96
24.54 ice creams
Independent variable
The variable we will use to predict it
(Temperature)
Dependent variable
The quantity we want to predict
(Ice cream sales)
